Original Scientific Paper, Volume 23, Number 2, Year 2025, No 1278, pp 345-358
Received: Jan 15, 2025 Accepted: Apr 24, 2025 Published: Jun 16, 2025
DOI: 10.5937/jaes0-56793
APPLYING MCDM METHODS FOR ELECTRIC VEHICLE SELECTION: A COMPARATIVE STUDY BETWEEN CRADIS AND PIV METHODS
Abstract
The global automotive industry is undergoing a significant transformation towards electric vehicles to significantly reduce carbon emissions and contribute to a greener planet. The proliferation of EVs is not only a trend but also an urgent solution to address climate change. In the context of a world striving for sustainable development, selecting the right electric vehicle becomes a crucial decision for consumers as one of the urgent solutions. This study employs two methods, CRADIS and PIV, to rank ten electric vehicle models and identify the optimal choice. Each vehicle is characterized by seven criteria, and the weighting of these criteria is determined using four methods: Entropy, LOPCOW, WENSLO, and combined weighting. This research also compares the CRADIS and PIV methods based on various similarity measures such as SPE (Spearman's coefficient), WPSE (Weighted Spearman's coefficient), RS (Rank Similarity coefficient), and KE (Kendall’s coefficient). The results indicate a slight advantage of the PIV method over the CRADIS method.
Highlights
- The CRADIS and PIV methods were applied for electric vehicle selection.
- The CRADIS and PIV methods were compared using various similarity measures.
- The PIV method demonstrated superior performance over CRADIS in similarity analyses
Nomenclature
|
EVs |
Electric Vehicles |
|
CRADIS |
Compromise Ranking of Alternatives from Distance to Ideal Solution |
|
WTT |
Well-To-Tank |
|
PIV |
Proximity Indexed Value |
|
LOPCOW |
Logarithmic Percentage Change-driven Objective Weighting |
|
WENSLO |
Weights by ENvelope and SLOpe |
|
SPE |
Spearman's Coefficient |
|
WPSE |
Weighted Spearman's coefficient |
|
RS |
Rank Similarity Coefficient |
|
KE |
Kendall’s Coefficient |
|
MCDM |
Multi-Criteria Decision-Making |
|
MABAC |
Multi-Attributive Border Approximation Area Comparison |
|
COCOSO |
Combined Compromise Solution |
|
MAIRCA |
Multi Attribute Ideal-Real Comparative Analysis |
|
VIKOR |
Više Kriterijumska Optimizacija i Kompromisno Rešenje |
|
ROV |
Range Of Value |
|
FUCA |
Faire Un Choix Adéquat |
|
TOPSIS |
Techniques for Order Preference by Similarity to an Ideal Solution |
|
WASPAS |
Weighted Aggregated Sum Product Assessment |
|
ARAS |
Additive Ratio Assessment |
|
SAW |
Simple Additive Weighting |
|
PSI |
Performance Selection Index |
|
MARCOS |
Measurement Of Alternatives And Ranking According To A Compromise Solution |
|
OPARA |
Objective Pairwise Adjusted Ratio Analysis |
|
COPRAS |
Complex Proportional Assessment |
|
EDAS |
Evaluation based on Distance from Average Solution |
|
RAM |
Root Assessment Method |
|
WSA |
Weighted Sum Approach |
|
PROMETHEE |
Preference Ranking Organization METHod for Enriched Evaluation |
|
MOORA |
Multi-Objective Optimization On The Basis Of Ratio Analysis |
|
AHP |
Analytic Hierarchy Process |
|
AROMAN |
Alternative Ranking Order Method Accounting for Two-Step Normalization |
|
MACONT |
Mixed Aggregation by COmprehensive Normalization Technique |
|
MARE |
Multi-Attribute Range Evaluations |
|
MCRAT |
Multiple Criteria Ranking By Alternative Trace |
|
SAW |
Simple Additive Weighting |
|
TOPSIS |
Techniques For Order Preference By Similarity To An İdeal Solution |
|
FUCA |
Faire Un Choix Adéqua |
|
CRITIC |
Criteria Importance Through Inter-Criteria Correlation |
|
ELECTRE |
ELimination and Choice Expressing REality |
|
QFD |
Quality Function Deployment |
|
ORESTE |
Organization, Rangement Et Synthese De Donnes Relationnels |
|
EVAMIX |
Evaluation of Mixed Data |
|
RRP |
Rank Reversal Phenomenon |
Keywords
Content
1 Introduction
The transportation sector, responsible for the daily movement of millions of passengers and tons of freight, plays a pivotal role in driving economic growth and industrialization. However, despite its critical importance, the sector presents a significant threat to human health due to its reliance on petroleum, becoming a major contributor to air pollution [1]. It is widely acknowledged that the key driver of global climate change is one of the significant contributors: the use and burning of fossil fuels from the industrial and residential sectors of the world [2]. Transportation is the main sector in terms of the consumption of fossil fuels, accounting for over 89% of petroleum energy use when compared to the average energy consumption across different industries [3]. On the other hand, electric vehicles (EVs) have attracted world interest mainly because of the expectation to contribute to the mitigation of gas emissions. For instance, according to the International Energy Agency's Global EV Outlook, in the first quarter of 2024, electric vehicle sales were strong, reaching over 3 million units, up about 25% from the same period in 2023 [4].
EVs represent not only a mode of transportation but also a revolution in the automotive industry and a sustainable solution to global environmental challenges. Compared to traditional gasoline-powered vehicles, EVs offer numerous advantages. Electric vehicles produce zero tailpipe emissions, contributing to reduced air pollution, ozone layer protection, and greenhouse gas emissions [5]. When examining the "well-to-tank" (WTT) phase of the EV lifecycle and its associated emissions, the availability of accurate and comprehensive data on WTT emissions can significantly influence the reliability of comparisons and rankings based on the environmental impacts of electric vehicles. On the other hand, emissions related to the WTT phase are largely dependent on the regional energy mix. Additionally, EVs provide a quiet and smooth driving experience, enhancing comfort and relaxation. Significant advancements in battery technology have substantially increased the driving range of EVs and shortened charging times [6]. Many modern electric vehicles are equipped with intelligent features such as driver-assistance systems, wireless connectivity, and partial autonomous driving capabilities, elevating the user experience [7]. The transition to electric vehicles not only benefits the environment but also stimulates economic growth [8]. The electric vehicle manufacturing industry creates numerous new jobs, from design and component production to maintenance and repair. Moreover, the development of charging infrastructure generates new business opportunities. With lower operating costs and government incentives, electric vehicles are becoming increasingly competitive compared to fossil fuel-powered vehicles, reducing the economic burden on consumers [9]. In summary, electric vehicles offer a comprehensive solution to environmental and energy challenges. With the support of government policies and emerging technologies, EVs are poised to become more prevalent and play a vital role in building a sustainable future.
However, selecting the right electric vehicle from the myriads of options available on the market today presents a significant challenge. Each model possesses unique specifications, ranging from price and charging time to driving range, leaving consumers perplexed [10]. Furthermore, factors such as design, features, and brand contribute to the diversity and complexity of the final decision. The application of multi-criteria decision-making (MCDM) methods is considered the optimal approach to overcome this challenge [11-13].
Various MCDM methodologies have been widely adopted in many fields. However, one common characteristic among them is that all the methods rely on "additive" algorithms, some of which are mixed with artificial or subjective factors; thus, all these methods are semi-quantitative and bring uncertainty to the final decision-making [14-15]. The CRADIS methodology provides not only a clear framework for decision-making but also seeks to reduce the shortages associated with other MCDM methods. The method is based on the evaluation of the deviations of alternatives from both the ideal and anti-ideal solution [16]. The CRADIS method has been used in a large deal of contemporary research across different fields including material selection [17], sustainability performance evaluation [18], multi-label feature selection [19]. The PIV method is known to reduce the occurrence of ranking reversal phenomenon 20-22]. The approach was applied in many works such as recent studies on the selection of suppliers [23], selecting the optimum solution for metal cutting [24], selecting machining process machine manufacturing [25].
This study aims to compare the CRADIS and PIV methods, whose advantages have been previously outlined, based on various similarity measures. In doing so, analyses are performed using the real-world problem of electric vehicle selection, and the methods are evaluated in terms of ranking consistency. The contributions of this study to existing literature are as follows:
- This study addresses a notable gap in literature by comparing the CRADIS and PIV methods through the application of different similarity measures such as Spearman’s coefficient (SPE), Weighted Spearman’s coefficient (WSPE), Rank Similarity coefficient (RS), Kendall’s coefficient (KE).
- By applying the methods to a real-life problem such as electric vehicle selection, the study demonstrates how theoretical decision-making methods perform when implemented in practical scenarios.
- The comparison of CRADIS and PIV methods in terms of ranking consistency provides valuable insights into the strengths and weaknesses of each method under varying conditions, shedding light on their relative robustness.
- The study offers new perspectives and potential avenues for future research by examining and contrasting the CRADIS and PIV methods, encouraging further exploration and refinement of MCDM techniques.
- The study enriches the understanding of the rank reversal phenomenon in the literature by analyzing how CRADIS and PIV respond to this issue, contributing to a deeper comprehension of its impact on various MCDM methods.
After the introduction, the second section presents the relevant literature in two sub-sections. The third section is dedicated to the application, while the final section focuses on the conclusions and recommendations.
1.1 Literature review
This section reviews studies that focus on the comparison of MCDM methods. It then explores MCDM applications in electric vehicle selection, highlighting the most frequently used criteria.
1.1.1 Studies focus on the comparison of MCDM methods
MCDM methods have been widely applied in various domains, and it is difficult to definitively state that one method is superior to another. Rather, it is more appropriate to say that certain methods are better suited for specific applications [26-27]. This is due to the inherent complexity of MCDM methods and the differences in algorithms employed by each method [28]. In fact, some studies have reported that to ensure the reliability of final decisions, it is necessary to solve each problem using several different MCDM methods [29-30]. Following this approach, numerous studies have been conducted to compare MCDM methods in various contexts.
Some studies have only compared the performance of methods based on whether they consistently identify the same best alternative, without considering the ranking of other alternatives or, in other words, the stability of the rankings when using different methods. MABAC, COCOSO, MAIRCA, VIKOR, and ROV methods have been shown to exhibit comparable performance when used to select the best alternative for metal cutting and the best alternative for office air quality [31]. The FUCA and PIV methods have shown similar performance when used to select materials for connecting rods [32]. Fuzzy variants of the TOPSIS, WASPAS, and ARAS methods have shown comparable performance when used for supplier selection [33]. The hybridization of the PSI and SAW methods to form the PSI-SAW method, the hybridization of the PSI and MARCOS methods to form the PSI-MARCOS method, and the PSI method itself have been evaluated as having comparable performance when used to select materials for connecting roads, gearbox housings, and gears [25]. When used to rank random number sets, the OPARA, SAW, WASPAS, COPRAS, TOPSIS, VIKOR, and EDAS methods have shown comparable effectiveness [34].
Some studies have compared MCDM methods based on both their agreement in identifying the best alternative and other statistical techniques. The hybridization of the FUCA and PSI methods to form the FUCA-PSI method, the hybridization of the PIV and PSI methods to form the PIV-PSI method, and the PSI method, when used to rank the digital transformation performance of several Vietnamese cities, have shown comparable effectiveness. Not only did these methods (FUCA-PSI, PIV-PSI, and PSI) consistently identify the same best alternative, but the similarity in the ranking of other alternatives was also very high when ranked using these three methods, with the smallest Spearman coefficient being 0.8361 [35]. When used to select materials under high-temperature, oxygen-rich conditions, the RAM method has not only outperformed the TOPSIS and VIKOR methods in identifying the best alternative among available options, but RAM has also exhibited greater resistance to ranking reversals compared to TOPSIS and VIKOR [36], etc.
Other studies have compared MCDM methods based on different criteria. The FUCA method has been verified to have higher performance than the WSA method when used to rank the financial status of companies. To sum it all up, calculating the Spearman coefficient between scenarios gave results whereby the FUCA method came out much more effective than the WSA method [37]. The effectiveness of the PROMETHEE method was superior to TOPSIS and SAW while using the Spearman coefficient between scenarios when evaluating stocks of companies by [38]. In another study, the use of the Spearman coefficient under different conditions showed that TOPSIS and MOORA have comparable and better performance concerning the VIKOR method when used for ranking sets of numbers [39].
In the assessment of calculation complexity, flexibility in decision-making, and comprehensiveness in facilitating group decisions, the VIKOR method proved more effective than TOPSIS and AHP in prioritizing metal casting techniques [40]. Using standard deviation along with scores of alternatives and computational complexity as evaluation criteria showed that among the MARCOS, AROMAN, and MACONT methods applied to the ranking of vacuum cleaner robots, the MARCOS method had the best performance while the MACONT method had the weakest performance [41]. Nevertheless, as regards the ranking of devices with respect to many criteria characterizing each alternative, it was shown that the AHP method is less effective than MARE and ELECTRE III when the number of criteria of the alternatives to be ranked increases, while MARE has been evaluated to have the highest performance. This can be explained by the fact that MARE depicts a higher precision in the handling of uncertain situations than the other two methods [42]. More so, it has also emerged that the AHP process may become challenged when dealing with large numbers of alternatives to be ranked or where it is faced with a considerably large number of criteria upon which each alternative is given [42-43].
The information above shows that the comparison of MCDM methods has been carried out using various approaches and applied in many different real-world situations. The comparison of two methods with outstanding advantages, such as CRADIS and PIV, will contribute to enriching the human knowledge base of MCDM methods. The comparison of CRADIS and PIV is considered with multiple comparison criteria, including comparing whether these two methods consistently identify the same best electric vehicle, and analyzing the stability in ranking alternatives when the weights of criteria are calculated using different methods.
1.1.2 Criteria frequently employed in electric vehicle selection within the MCDM framework
In recent years, with the issues of environmental sustainability and energy efficiency becoming more apparent, there has been a dramatic shift taking place within the transportation sector. One of the major components of this transformation is electric vehicles. From an environmental point of view, electric vehicles emit no tailpipe emissions and thus help to lower localized pollution, being of especial importance in highly populated urban areas [44]. With increasing interest in electric vehicles (EVs), numerous criteria have been developed to lead the evaluation and selection of these vehicles. Table 1 summarizes the criteria used in electric vehicle (EV) selection in studies employing the MCDM approach, as an overview.
Table 1. The criteria commonly employed in the selection of EVs
|
Sources |
[45] |
[46] |
[47] |
[48] |
[49] |
[50] |
[51] |
[52] |
[53] |
[54] |
[55] |
[56] |
[57] |
[58] |
[59] |
[60] |
[61] |
[62] |
[63] |
[64] |
|
Range |
ü |
ü |
|
ü |
|
|
ü |
ü |
|
ü |
ü |
ü |
|
|
ü |
|
ü |
ü |
|
ü |
|
Smart features |
|
|
ü |
ü |
|
|
|
ü |
ü |
ü |
ü |
|
|
ü |
|
ü |
|
|
|
|
|
Performance |
ü |
ü |
|
|
|
|
|
|
|
|
ü |
|
|
|
|
|
|
|
|
|
|
Battery life |
ü |
ü |
|
|
ü |
ü |
ü |
ü |
ü |
ü |
ü |
|
ü |
|
|
ü |
ü |
|
|
ü |
|
Storage space |
|
|
ü |
|
|
|
|
|
|
|
ü |
|
|
ü |
|
|
|
|
|
|
|
Price |
ü |
ü |
ü |
ü |
ü |
ü |
|
ü |
|
ü |
ü |
ü |
ü |
|
ü |
ü |
ü |
ü |
ü |
ü |
|
Charging time |
ü |
ü |
|
ü |
|
ü |
|
|
|
ü |
ü |
ü |
|
ü |
ü |
ü |
ü |
|
ü |
ü |
|
Appearance; |
|
|
ü |
|
|
|
|
|
|
|
|
|
|
|
|
|
|
|
|
ü |
|
No. of doors |
|
|
|
|
|
|
|
ü |
|
|
|
|
|
|
|
|
|
|
|
|
|
No. of airbags |
|
|
|
|
|
|
|
ü |
|
|
|
|
|
|
|
|
|
|
|
|
|
Seating capacity; |
ü |
ü |
|
ü |
|
|
|
|
|
|
|
|
|
|
|
|
|
|
ü |
|
|
Acceleration |
ü |
ü |
|
ü |
|
|
ü |
ü |
|
ü |
|
ü |
ü |
|
ü |
|
ü |
|
|
|
|
After-sales cost |
|
|
|
ü |
|
|
|
|
|
|
|
|
|
|
|
|
|
|
|
|
|
Top speed |
ü |
ü |
|
ü |
|
ü |
ü |
|
|
ü |
|
ü |
ü |
|
ü |
|
ü |
ü |
ü |
ü |
|
Fastcharge time |
|
|
|
|
|
|
ü |
|
|
|
|
ü |
|
|
|
|
ü |
|
|
ü |
|
Weight unladen |
ü |
ü |
|
ü |
ü |
ü |
|
|
|
|
|
ü |
|
|
|
|
|
|
ü |
ü |
|
Full charge time |
ü |
ü |
|
|
|
ü |
ü |
|
|
|
|
|
|
|
|
|
|
|
|
|
|
Comb. fuel economy |
ü |
ü |
ü |
ü |
|
|
|
|
ü |
|
|
|
ü |
ü |
ü |
ü |
|
ü |
|
ü |
|
Reliability |
|
|
|
|
|
|
|
|
ü |
|
|
|
|
ü |
|
|
|
|
|
|
|
Width |
|
|
|
|
ü |
|
|
|
|
|
|
|
|
|
|
|
|
|
|
|
|
Resale value |
|
|
|
|
|
|
|
|
|
|
|
|
|
ü |
|
|
|
|
|
|
|
Safety |
|
|
|
ü |
|
ü |
|
|
ü |
|
|
|
|
|
|
|
|
|
|
|
|
Greenhouse gases |
|
|
|
|
|
|
|
|
ü |
|
|
|
|
|
|
|
|
|
|
|
|
Vehicle weight |
|
|
|
|
|
|
ü |
|
|
ü |
|
|
|
|
ü |
|
|
|
|
|
|
Engine power |
|
|
ü |
|
|
|
ü |
|
|
|
|
|
|
|
ü |
|
ü |
|
|
ü |
|
Maximum torque |
|
|
|
ü |
|
ü |
|
ü |
|
ü |
|
|
|
|
ü |
|
ü |
ü |
|
ü |
|
Aesthetic |
|
|
|
|
|
|
|
|
|
|
|
|
|
|
|
ü |
|
|
|
|
|
Air pollution |
|
|
|
|
|
|
|
|
|
|
|
|
|
|
|
ü |
|
|
|
|
|
Durability |
|
|
|
|
|
|
|
|
|
|
|
|
|
|
|
ü |
|
|
|
|
|
Voltage |
|
|
|
|
|
|
|
|
|
ü |
|
|
|
|
|
|
|
|
|
|
|
Height |
|
|
|
|
|
|
|
|
|
ü |
|
|
|
|
|
|
|
|
|
|
|
Wheelbase |
|
|
|
|
|
|
|
ü |
|
ü |
|
|
|
|
|
|
|
|
|
|
|
Cargo volume |
|
|
|
|
ü |
|
ü |
|
|
ü |
|
ü |
|
|
|
|
ü |
|
|
ü |
As seen in Table 1, criteria such as range, battery life, price, charging time, acceleration, top speed and combined fuel economy are the most frequently preferred. In contrast, criteria such as appearance, no. of doors, no. of airbags, after-sales cost, reliability and width are also among the factors influencing EV selection, but they have been examined less frequently than the others. When considering the number of criteria used in the studies, it is evident that each study includes at least five criteria. Decision-making models suggested in the literature for EV selection have also been reviewed. In this regard, AHP is the most used weighting technique, while Entropy ranks as the second most frequently used. On the other hand, studies where weights were determined solely based on expert opinions, without a methodological framework, are also notable [49, 53, 58,61]. The study utilizing the QFD technique is also noteworthy [50]. Among the techniques used in EV ranking, TOPSIS is the most frequently applied, with MARCOS, MABAC, and COPRAS also being preferred by researchers. Additionally, the use of techniques such as ORESTE, FUCOM, AROMAN, and EVAMIX appears to be limited [47, 52, 54]. On the other hand, the study conducted by Dimic-Misic et al. [65] aimed to address key questions regarding the development of the electric vehicle (EV) concept based on findings from the past decade. Additionally, the study provided a comprehensive assessment of the future development of raw materials for EV batteries.
2 Materials and methods
The steps for scoring and ranking alternatives using the CRADIS method are as follows [16]:
Step 1: Normalize data using Eqs. (1-2).
$n_{ij}=\frac{x_{ij}}{x_{jmax}}$ (1)
$n_{ij}=\frac{x_{jmin}}{x_{ij}}$ (2)
Step 2: Calculate the weighted normalized values using Eq. (3).
$v_{ij}=n_{ij}\ast w_j$ (3)
Step 3: Determine the ideal and anti-ideal solutions using Eqs. (4) and (5).
$t_i={maxv}_{ij}$ (4)
$t_{ai}={minv}_{ij}$ (5)
Step 4: Calculate the deviations from the ideal and anti-ideal solutions using Eqs. (6) and (7).
$d^+=t_i-v_{ij}\ $ (6)
$d^-=v_{ij}-t_{ai}$ (7)
Step 5: Calculate the values s+ and s- using Eqs. (8) and (9).
$s^+=\sum_{j=1}^{n}d^+$ (8)
$s^-=\sum_{j=1}^{n}d^-$ (9)
Step 6: Calculate the values Ki+ and Ki- using Eqs. (10) and (11).
$K_i^+=\frac{s_0^+}{s_i^+}$ (10)
$K_i^-=\frac{s_i^-}{s_0^-}\ $ (11)
Step 7: The values Qi, calculated using Eq. (12), are used to rank the alternatives. The alternative with the highest Qi value is the best.
$Q_i=\frac{K_i^++K_i^-}{2}$ (12)
Step 4: Rank the alternatives based on the principle that the best alternative is the one with the highest overall probability.
The steps for the PIV method are as follows [20]:
Step 1: Determine the normalized values according to Eq. (13).
$r_i=\frac{x_i}{\sqrt{\sum_{i=1}^{m}x_i^2}}\ $ (13)
Step 2: Calculate the weighted normalized values according to Eq. (14).
$v_i=w_i\ast r_i $ (14)
Step 3: Determine the weighted proximity index for each alternative. Eq. (15) is applied for benefit criteria, and Eq. (16) is applied for cost criteria.
$u_i=v_{max}-v_i$ (15)
$u_i=v_i-v_{min}\ $ (16)
Step 4: Determine the overall proximity value according to Eq. (17).
$d_i=\sum_{j=1}^{n}u_i$ (17)
Step 5: Rank the alternatives based on the principle that the alternative with the smallest di is the best alternative.
Four weighting methods were used to calculate the weights of the criteria in this study: Entropy, LOPCOW, WENSLO and a combined method. Entropy, LOPCOW, and WENSLO are three objective weighting methods. Objective weighting methods are the most used because the weights of the criteria are not influenced by any subjective opinions of the decision-maker [66-67]. The combined weight is a combination of the weights calculated using the Entropy, LOPCOW, and WENSLO methods according to Eq. (18) [68]. Where the symbols , , , respectively, represent the weight of criterion j calculated using the Entropy, LOPCOW, and WENSLO, and combined methods.
$W_j^{(Co)}=\frac{W_j^{(En)}.W_j^{(Lop)}.W_j^{(Wens)}}{\sum_{j=1}^{n}\left[W_j^{(En)}.W_j^{(Lop)}.W_j^{(Wens)}\right]}$ (18)
3.1. Similarity measures
This section uses four metrics to evaluate the consistency of rankings between the CRADIS and PIV methods, in terms of rank order correlation and similarity. SPE, WPSE, RS, and KE metrics were used to test the stability of the rankings when the criteria of weight calculation methods vary [69].
- Spearman’s coefficient (SPE)
Spearman's rank correlation is defined for ranking values and as shown in Eq. (19) [70].
$SPE=1-\frac{6}{m\left(m^2-1\right)}\sum_{i\in Z}\left[\sigma\left(i\right)-p\left(i\right)\right]^2\ $ (19)
- Weighted Spearman’s coefficient (WSPE)
The Weighted Spearman correlation for a sample of size m with ranking values σ(i) and ρ(i) is defined in Eq. (20). The key difference from Spearman's rank correlation is that the Weighted Spearman coefficient can investigate when and where the differences happen. Consequently, discrepancies at the top ranks of both sequences have a greater influence on the correlation values [71-73].
$WSPE=1-\frac{6}{m^4+m^3-m^2-m}\sum_{\alpha\in Z}{\left[\sigma\left(i\right)-\rho(i)\right]^2\left(2m-2-\sigma\left(i\right)-\rho(i)\right)}$ (20)
- Rank Similarity coefficient (RS)
This is an asymmetric measure, where the weight of a given comparison is determined by the significance of the position in the reference ranking used during the calculation [71].
$RS=1-\sum_{i\in Z}\frac{2^{-\sigma\left(i\right)}}{max\left(\left|\sigma\left(i\right)-1\right|,\left\lceil\sigma\left(i\right)-m\right\rceil\right)}\left|\sigma\left(i\right)-\rho\left(i\right)\right|\ \ $ (21)
- Kendall’s coefficient (KE)
This correlation coefficient is based on the number of rank pairs that must be reversed to convert one ranking into another [71]. The Kendall's Tau correlation is defined in Equation (22).
$KE=\frac{2(p-q)}{m(m-1)}\ $ (22)
In Eqs. (19-21), indicates the difference in the rank of alternative i when ranked by different MCDM methods or when ranked using the same MCDM method but the weights of the criteria are calculated using different methods.
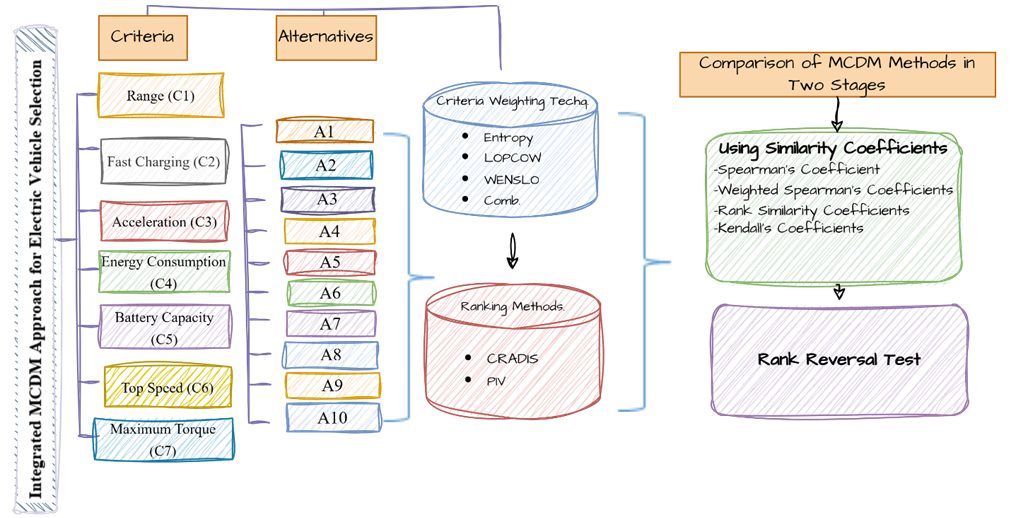
Fig. 1. A MCDM framework for electric vehicle selection
3 Results and discussion
In this study, the CRADIS and PIV methods are compared based on various metrics, considering the ranking order correlation and the real-life problem of electric vehicle selection. In this context, 10 electric vehicle alternatives produced in 2024 were selected, and seven frequently used criteria were identified based on the comprehensive literature review conducted in Section 2. The selected criteria align with the key factors influencing EV adoption. It is well known that consumers prioritize driving range, charging speed, and power performance. Additionally, according to Table 1, commonly used criteria include range, battery life, price, charging time, acceleration, top speed, and combined fuel economy. Since the price information for the newly produced vehicles has not yet been disclosed, the Price criterion was not included in this study. Table 2 presents the explanations of the criteria; Table 3 summarizes the data for ten different electric vehicle models under seven criteria. Among these, C1 to C4 are the "smaller the better" criteria, and C5 to C7 are the "the larger the better" criteria.
Table 2. Description of criteria
|
Criteria |
Unit |
Description |
|
Range (C1) |
km |
The driving range is the maximum distance a vehicle can travel after its batteries are fully charged. |
|
Fast Charging (C2) |
kW |
This refers to the charging time of electric vehicles in the range of 20% to 80%, expressed in minutes. |
|
Acceleration (C3) |
s |
This is an expression of the acceleration time from 0 to 100 km in seconds. |
|
Energy Consumption (C4) |
kWh/100km |
Electricity consumption per 100 kilometers |
|
Battery Capacity (C5) |
kW/h |
This is the expression of the amount of electrical energy a battery can store, measured in kW/h. |
|
Top Speed (C6) |
km/h |
It is the speed at which the car can operate without issues, with all components functioning under warranty. |
|
Maximum Torque (C7) |
Nm |
It represents the force generated by the engine. |
Table 3. Electric vehicle models
|
Alt. |
C1 |
C2 |
C3 |
C4 |
C5 |
C6 |
C7 |
|
TOGG T10F 218 PS (A1) |
350 |
28 |
7.2 |
16 |
52.4 |
180 |
350 |
|
Xiaomi SU7 295 HP (A2) |
668 |
15 |
5.3 |
12.5 |
73.6 |
210 |
400 |
|
Ssangyong Torres EVX 207 PS (A3) |
635 |
37 |
8.11 |
18.6 |
73.4 |
175 |
339 |
|
Renault 5 E-Tech 150 HP (A4) |
400 |
26 |
7.5 |
13 |
52 |
150 |
245 |
|
Hyundai IOVIQ 6 151 BG Progressive (A5) |
429 |
32 |
8.8 |
16.1 |
53 |
185 |
350 |
|
Kia EV3 204 PS GT Line (A6) |
584 |
29 |
7.9 |
14.9 |
81.4 |
170 |
283 |
|
Opel Combo 136 HP Edition (A7) |
346 |
30 |
11.7 |
19.5 |
50 |
132 |
270 |
|
Volvo EX30 272 HP (A8) |
344 |
26 |
5.4 |
16.7 |
51 |
180 |
343 |
|
Tesla Cybertruck Cyberbrast 845 HP (A9) |
515 |
15 |
2.7 |
15.4 |
123 |
209 |
740 |
|
Citroen e-C3 113 BG (A10) |
320 |
26 |
11 |
16.4 |
45 |
135 |
120 |
The weights of the criteria were calculated using the Entropy, LOPCOW, WENSLO, and combined methods, and are summarized in Table 4. The ranking results of the alternatives using the CRADIS and PIV methods are presented in Table 5.
Table 4. Weights of criteria
|
Weight method |
C1 |
C2 |
C3 |
C4 |
C5 |
C6 |
C7 |
|
Entropy |
0.1236 |
0.1138 |
0.2096 |
0.0291 |
0.1807 |
0.0387 |
0.3044 |
|
LOPCOW |
0.1708 |
0.1293 |
0.1735 |
0.1712 |
0.0715 |
0.1616 |
0.1221 |
|
WENSLO |
0.0838 |
0.0961 |
0.1795 |
0.0282 |
0.1989 |
0.0284 |
0.3850 |
|
Combination |
0.0658 |
0.0526 |
0.2426 |
0.0052 |
0.0956 |
0.0066 |
0.5317 |
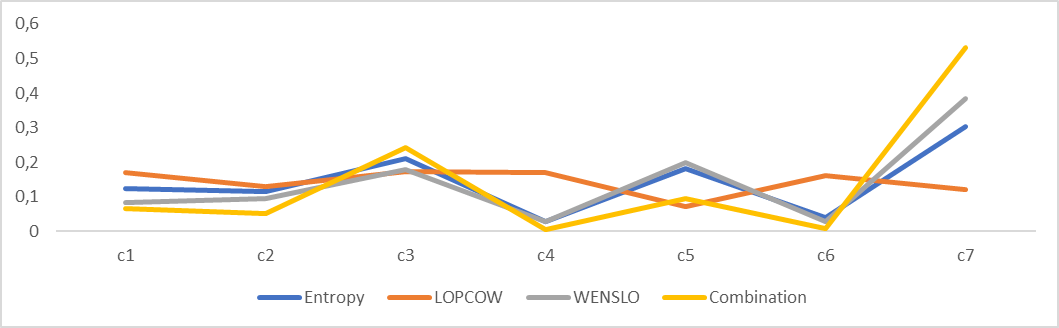
Fig. 2. Weights of criteria
From the above results, it can be established that the rankings obtained using Entropy, WENSLO, and combined weight methods are consistent, while the LOPCOW rankings are different from the other methods. These results are consistent with the findings of [45] where different results were obtained based on different weighting techniques. Taking a final general assessment into account after considering combined weight results, the highest importance level is assigned to criterion C7 (Maximum torque). This criterion also has a high importance in the study by [54]. Also, C3 (Acceleration) has much higher importance compared to the other criteria. This criterion also has high importance in the study by [51]. Specific details about the remaining five criteria, which include C4 (Energy consumption) and C6 (Top speed), are less important. The result is generally consistent with a part of literature findings [59, 62, 54, 50-51]. On the other hand, it should be noted that MCDM methods may be sensitive to the dataset used, as well as to the number of alternatives and criteria.
Table 5. Comparative analysis result of CRADIS and PIV based on different weights ( S: Score, R: Rank)
|
|
CRADIS |
PIV |
|
||||||||||||||
|
|
Entropy |
LOPCOW |
WENSLO |
Comb. |
Entropy |
LOPCOW |
WENSLO |
Comb. |
|
||||||||
|
|
S |
R |
S |
R |
S |
R |
S |
R |
S |
R |
S |
R |
S |
R |
S |
R |
|
|
A1 |
0.582 |
4 |
0.488 |
4 |
0.388 |
4 |
0.654 |
4 |
0.219 |
4 |
0.138 |
4 |
0.242 |
4 |
0.259 |
4 |
|
|
A2 |
0.656 |
2 |
0.576 |
2 |
0.827 |
2 |
0.708 |
2 |
0.178 |
2 |
0.108 |
2 |
0.193 |
2 |
0.214 |
2 |
|
|
A3 |
0.541 |
7 |
0.396 |
10 |
0.813 |
6 |
0.631 |
6 |
0.250 |
7 |
0.194 |
8 |
0.261 |
6 |
0.281 |
6 |
|
|
A4 |
0.538 |
8 |
0.464 |
5 |
0.792 |
8 |
0.600 |
8 |
0.251 |
8 |
0.152 |
5 |
0.279 |
8 |
0.310 |
8 |
|
|
A5 |
0.550 |
6 |
0.447 |
6 |
0.791 |
7 |
0.635 |
5 |
0.244 |
6 |
0.162 |
6 |
0.262 |
7 |
0.280 |
5 |
|
|
A6 |
0.551 |
5 |
0.432 |
7 |
0.799 |
5 |
0.617 |
7 |
0.239 |
5 |
0.167 |
7 |
0.257 |
5 |
0.293 |
7 |
|
|
A7 |
0.518 |
9 |
0.398 |
9 |
0.786 |
9 |
0.592 |
9 |
0.287 |
9 |
0.206 |
10 |
0.309 |
9 |
0.341 |
9 |
|
|
A8 |
0.604 |
3 |
0.509 |
3 |
0.799 |
3 |
0.672 |
3 |
0.205 |
3 |
0.125 |
3 |
0.231 |
3 |
0.244 |
3 |
|
|
A9 |
0.948 |
1 |
0.787 |
1 |
0.913 |
1 |
0.982 |
1 |
0.018 |
1 |
0.032 |
1 |
0.013 |
1 |
0.009 |
1 |
|
|
A10 |
0.484 |
10 |
0.416 |
8 |
0.858 |
10 |
0.530 |
10 |
0.314 |
10 |
0.198 |
9 |
0.349 |
10 |
0.399 |
10 |
|
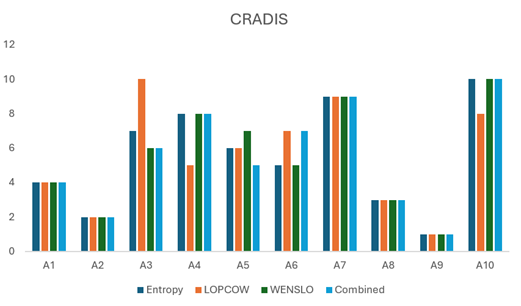
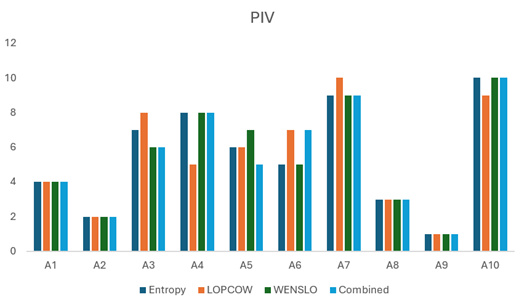
Fig. 3. Comparative analysis result of CRADIS and PIV based on various weights
All the data in Table 5 and Figure3 point out A9 to be the best alternative under all scenarios, strongly supporting A4 to be the best electric car. This means that CRADIS and PIV methods have very similar performances when it comes to determining the best alternative among the ranked options. This contrasts with the A1, A2, and A8 rankings, which, as is observed, remain unchanged across all scenarios but still occupy the 4th, 2nd, and 3rd position, respectively. Based on Figure 3, although the ranking of CRADIS and PIV appears relatively similar, there is a change in position of some of the alternatives, which includes A3, A4, A7, and A10. To provide a better comparison between these methods, the SPE, WPSE, RS and KE metrics were calculated utilizing the Eqs. (19-22).
4.1. Comparison of CRADIS and PIV based on similarity coefficients
Table 6 summarizes the SPE, WPSE, RS, and KE coefficients calculated for each case when the criteria weights are determined using two different methods. For example, the notation "Entropy/LOPCOW" in Table 6 indicates that the corresponding SPE, WPSE, RS, and KE coefficients were calculated using the Entropy and LOPCOW methods to determine the criteria weights.
Table 6. Comparison of CRADIS and PIV under various metrics
|
Entopy/ LOPCOW |
Entopy/ WENSLO |
Entopy/ Comb. |
LOPCOW/ WENSLO |
LOPCOW/Comb. |
WENSLO/Comb. |
Average |
Deviation (%) |
||
|
SPE |
PIV |
0.9030 |
0.9879 |
0.9636 |
0.8788 |
0.9030 |
0.9515 |
0.9313 |
4.21 |
|
CRADIS |
0.8424 |
0.9879 |
0.9636 |
0.7939 |
0.8182 |
0.9515 |
0.8929 |
||
|
WSPE |
PIV |
0.8512 |
0.9802 |
0.9372 |
0.7950 |
0.8314 |
0.9207 |
0.8860 |
6.28 |
|
CRADIS |
0.7421 |
0.9802 |
0.9372 |
0.6826 |
0.7190 |
0.9207 |
0.8303 |
||
|
RS |
PIV |
0.9906 |
0.9974 |
0.9905 |
0.9849 |
0.9867 |
0.9913 |
0.9902 |
.031 |
|
CRADIS |
0.9889 |
0.9974 |
0.9905 |
0.9848 |
0.9865 |
0.9913 |
0.9899 |
||
|
KE |
PIV |
0.7778 |
0.9556 |
0.9111 |
0.7556 |
0.8222 |
0.8667 |
0.8481 |
5.68 |
|
CRADIS |
0.7333 |
0.9556 |
0.9111 |
0.6444 |
0.6889 |
0.8667 |
0.8000 |
According to the data in Table 6, when each scenario pair is compared, the values of the SPE, WPSE, RE, and KE coefficients show minimal variation between the CRADIS and PIV methods. However, upon closer inspection, it is evident that the PIV method has a slight advantage over the CRADIS method. The following statistics further clarify this observation. In the two different weight scenarios, Entropy and LOPCOW, when the PIV method is used, the SPE, WPSE, RS, and KE coefficients are higher compared to the CRADIS method (SPE: 0.903-0.842, WPSE: 0.851-0.742, RS: 0.990-0.989, KE: 0.777-0.733). On the other hand, when using Entropy-WENSLO, Entropy-Comb., or WENSLO-Comb., the SPE, WPSE, RS, and KE coefficients for both the PIV and CRADIS methods are equal. According to the results for LOPCOW/WENSLO and LOPCOW-Comb., in every case, the PIV method is more advantageous than the CRADIS method. The average SPE coefficient for all comparisons is 0.9313 for the PIV method and 0.8929 for the CRADIS method, showing a difference of approximately 4.21%. For the WPSE, RS, and KE coefficients, when the PIV method is used, the average values of these coefficients are higher compared to the CRADIS method, although the difference is especially small for RS: the difference for the WPSE coefficient is 6.28%, for RS it is 0.031%, and for KE it is 5.68%. Overall, these data indicate that the PIV method is superior to the CRADIS method.
4.2. Rank reversal test
In this section, an RRP test was conducted following a methodology similar to that of [74]. In this approach, sub-optimal alternatives were deliberately eliminated at each stage, and the ranking orders of the remaining options were assessed. The effect of this process on the Combined Weight-Based CRADIS and PIV results was evaluated. The outcomes are presented in Table 7.
Table 7. RR test results based on CRADIS and PIV
|
|
CRADIS |
PIV |
|
Current Ranking |
A9>A2>A8>A1>A5>A3>A6>A4>A7>A10 |
A9>A2>A8>A1>A5>A3>A6>A4>A7>A10 |
|
Exclusion of A10 |
A9>A2>A8>A1>A5>A3>A6>A4>A7 |
A9>A2>A8>A1>A5>A3>A6>A4>A7 |
|
Exclusion of A10, A7 |
A9>A2>A8>A1>A5>A3>A6>A4 |
A9>A2>A8>A1>A5>A3>A6>A4 |
|
Exclusion of A10, A7, A4 |
A9>A2>A8>A1>A5>A3>A6 |
A9>A2>A8>A1>A5>A3>A6 |
|
Exclusion of A10, A7, A4, A6 |
A9>A2>A8>A1>A5>A3 |
A9>A2>A8>A1>A5>A3 |
|
Exclusion of A10, A7, A4, A6, A3 |
A9>A2>A8>A1>A5 |
A9>A2>A8>A1>A5 |
|
Exclusion of A10, A7, A4, A6, A3, A5 |
A9>A2>A8>A1 |
A9>A2>A8>A1 |
|
Exclusion of A10, A7, A4, A6, A3, A5, A1 |
A9>A2>A8 |
A9>A2>A8 |
|
Exclusion of A10, A7, A4, A6, A3, A5, A1, A8 |
A9>A2 |
A9>A2 |
|
Exclusion of A10, A7, A4, A6, A3, A5, A1, A8, A2 |
A9 |
A9 |
Initially, the CRADIS and PIV results were compared within the scope of the RR test using the criterion weights obtained through the Combined Weight approach. The Combined Weight-based CRADIS and PIV rankings were found to be identical (r=1), as shown in the first row of Table 7. Subsequently, the alternatives with the worst performance were sequentially removed, and the CRADIS and PIV analysis steps were repeated. First, the alternative A10, which ranked last in both rankings, was removed from the decision matrix, and the analysis was repeated. In this manner, nine scenarios were generated, and the rankings of the alternatives remained consistent across all scenarios. As a result, it was concluded that both the CRADIS and PIV methods exhibited no significant sensitivity to RRP.
4 Conclusions
This study employed both the CRADIS and PIV methods to rank and select the best electric vehicle among the ten available options. The weights of the criteria for evaluating each electric vehicle were calculated using four different methods: Entropy, LOPCOW, WENSLO, and a combination of these methods. In this study, which considered seven criteria (Range, fast charging, acceleration, energy consumption, battery capacity, top speed, maximum torque), the combined weight results identified C7 (maximum torque) as the most important criterion. According to the CRADIS and PIV results obtained based on the four different weighting techniques, the alternative ranked first was A9, and this result remained consistent across all scenarios.
In this study, where the ranking consistency of the CRADIS and PIV methods was compared based on various metrics such as the SPE, WPSE, RS, and KE coefficients, it was found that the PIV method exhibited a slight advantage over the CRADIS method. Additionally, an RRP test was conducted to assess the sensitivity of the ranking methods. As a result, it was concluded that both the CRADIS and PIV methods showed no significant sensitivity to RRP.
The limitations of this study can be expressed as follows: Only ten electric vehicles were evaluated in this study, and a broader range of alternatives was not considered. This limitation may restrict the generalizability of the results. The criteria used to evaluate electric vehicles are limited to a specific set, which may reduce the external validity of the research. Future studies should broaden the range of alternatives and criteria, incorporating vehicles from different segments and brands, as well as additional criteria, to provide a more comprehensive analysis. In this study, rankings were performed using only the CRADIS and PIV methods based on various metrics. Future research could compare different MCDM methods within a similar framework.
Acknowledgements
No external funding or support was received for this study.
References
- Rehman, F. U., Islam, M. M., Miao, Q. (2023). Environmental sustainability via green transportation: A case of the top 10 energy transition nations. Transport Policy, vol. 137, 32-44, DOI: 10.1016/j.tranpol.2023.04.013
- Kene, R., Olwal, T., van Wyk, B. J. (2021). Sustainable electric vehicle transportation. Sustainability, vol. 13, no. 22, 1-16, DOI: 10.3390/su132212379.
- Outlook, A.E. (2024). Energy information administration, from https://www.eia.gov/energyexplained/us-energy-facts/ accessed on 2024-27-12.
- International Energy Agency (IEA), from https://www.eia.gov/energyexplained/us-energy-facts/ accessed on 2024-27-12.
- Mousavinezhad, S., Choi, Y., Khorshidian, N., Ghahremanloo, M., & Momeni, M. (2024). Air quality and health co-benefits of vehicle electrification and emission controls in the most populated United States urban hubs: Insights from New York, Los Angeles, Chicago, and Houston. Science of The Total Environment, vol. 912, no. 20, 169577. https://doi.org/10.1016/j.scitotenv.2023.169577
- Alanazi, F. (2023). Electric vehicles: benefits, challenges, and potential solutions for widespread adaptation. Applied Sciences, vol. 13, no. 10, 6016, DOI: 10.3390/app13106016
- Yusuf, S. A., Khan, A., Souissi, R. (2024). Vehicle-to-everything (V2X) in the autonomous vehicles domain–A technical review of communication, sensor, and AI technologies for road user safety. Transportation Research Interdisciplinary Perspectives, vol. 23, 100980, DOI: 10.1016/j.trip.2023.100980
- Singh, D., Paul, U. K., Pandey, N. (2023). Does electric vehicle adoption (EVA) contribute to clean energy? Bibliometric insights and future research agenda. Cleaner and Responsible Consumption, vol. 8, 100099, DOI: 10.1016/j.clrc.2022.100099
- Pamidimukkala, A., Kermanshachi, S., Rosenberger, J. M., Hladik, G. (2024). Barriers and motivators to the adoption of electric vehicles: a global review. Green Energy and Intelligent Transportation, 100153, DOI: 10.1016/j.geits.2024.100153
- Shahed, M. T., Rashid, A. H. U. (2024). Battery charging technologies and standards for electric vehicles: A state-of-the-art review, challenges, and future research prospects. Energy Reports, vol. 11, 5978-5998, doı: 10.1016/j.egyr.2024.05.062
- Trung, Đ. Đ. (2021a). Multi-objective optimization of SKD11 steel milling process by reference ideal method. International journal of geology, vol. 15, 1-15, DOI: 10.46300/9105.2021.15.1
- Nguyen, A. T. (2023). The improved CURLI method for multi-criteria decision making. Engineering, Technology & Applied Science Research, vol. 13, no. 1, 10121-10127, DOI: 10.48084/etasr.5538
- Van Dua, T., Van Duc, D., Bao, N. C. (2024). Integration of objective weighting methods for criteria and MCDM methods: application in material selection. EUREKA: Physics and Engineering, no. 2, 131-148, https://doi.org/10.21303/2461-4262.2024.003171
- Zheng, M., Teng, H., Wang, Y. (2021). A simple approach for multi-criteria decision-making on basis of probability theory. Engineering Structures and Technologies, vol. 13, no. 1, 26-30, DOI: 10.3846/est.2021.18404
- Sun, C., Li, S., Deng, Y. (2020). Determining weights in multi-criteria decision making based on negation of probability distribution under uncertain environment. Mathematics, vol. 8, no. 2, 191, DOI: 10.3390/math8020191
- Puška, A., Stević, Ž., Pamučar, D. (2021). Evaluation and selection of healthcare waste incinerators using extended sustainability criteria and multi-criteria analysis methods. Environment, Development and Sustainability, vol. 24, no. 9, 11195-11225, DOI: 10.1007/s10668-021-01902-2
- Chakraborty, S., Chatterjee, P., Das, P. P. (2024). Compromise Ranking of Alternatives from Distance to Ideal Solution (CRADIS) Method. In Multi-Criteria Decision-Making Methods in Manufacturing Environments (pp. 343-347). Apple Academic Press.
- Işık, Ö., Adalar, İ. (2025). A multi-criteria sustainability performance assessment based on the extended CRADIS method under intuitionistic fuzzy environment: a case study of Turkish non-life insurers. Neural Computing and Applications, vol. 37, no. 5, 3317-3342, DOI: 10.1007/s00521-024-10803-0
- Mohanrasu, S. S., Rakkiyappan, R. (2024). A novel framework for multi-label feature selection: integrating mutual information and Pythagorean fuzzy CRADIS. Granular Computing, vol. 9, no. 3, 67, DOI: 10.1007/s41066-024-00489-z
- Mufazzal, S., Muzakkir, S. M. (2018). A new multi-criterion decision making (MCDM) method based on proximity indexed value for minimizing rank reversals. Computers & Industrial Engineering, vol. 119, 427-438, DOI: 10.1016/j.cie.2018.03.045
- Trung, D. D. (2021b). Application of EDAS, MARCOS, TOPSIS, MOORA and PIV methods for multi-criteria decision making in milling process, Journal of Mechanical Engineering, vol. 71, no. 2, 69-84, DOI:10.2478/scjme-2021-0019
- Saluja, R. S., Mathew, M., Singh, V. (2023). Improved proximity indexed value MCDM method for solving the rank reversal problem: A simulation-based approach. Arabian Journal for Science and Engineering, vol. 48, no. 9, 11679-11694, DOI: 10.1007/s13369-022-07553-3
- Behera, D. K., Beura, S. (2023). Supplier selection for an industry using MCDM techniques. Materials Today: Proceedings, vol. 74, no. 4, 901-909, DOI: 10.1016/j.matpr.2022.11.291
- Thinh, H. X. (2022). Comparison of the RAFSI and PIV method in multi-criteria decision making: application to turning processes. International Journal of Metrology and Quality Engineering, vol. 13, no. 14, DOI: 10.1051/ijmqe/2022014
- Van Dua, T. (2025). Application of the PSI Method in Selecting Sustainable Energy Development Technologies. Engineering, Technology & Applied Science Research, vol. 15, no. 1, 19596-19601, DOI: 10.46793/aeletters.2024.9.3.2
- Athawale, V. M., Chakraborty, S. (2012). Material selection using multi-criteria decision-making methods: a comparative study. Proceedings of the Institution of Mechanical Engineers, Part L: Journal of Materials: Design and Applications, vol. 226, no. 4, 266-285, DOI: 10.1177/1464420712448979
- Sahoo, S. K., Goswami, S. S. (2023). A comprehensive review of multiple criteria decision-making (MCDM) Methods: advancements, applications, and future directions. Decision Making Advances, vol. 1, no. 1, 25-48, DOI: 10.31181/dma1120237
- Dhurkari, R. K. (2022). MCDM methods: Practical difficulties and future directions for improvement. RAIRO-Operations Research, vol. 56, no. 4, 2221-2233, DOI: 10.1051/ro/2022060
- Mian, S. H., Nasr, E. A., Moiduddin, K., Saleh, M., Abidi, M. H., & Alkhalefah, H. (2024). Assessment of consolidative multi-criteria decision making (C-MCDM) algorithms for optimal mapping of polymer materials in additive manufacturing: A case study of orthotic application, Heliyon, vol. 10, 1-29, DOI: 10.1016/j.heliyon.2024.e30867
- Ogrodnik, K. (2023). Application of MCDM/MCDA methods in city rankings-review and comparative analysis. Economics and Environment, vol. 86, no. 3, 132-151, DOI: 10.34659/eis.2023.86.3.689
- Dung, H. T., Do, D. T. (2022). Comparison of multi-criteria decision making methods using the same data standardization method, Journal of Mechanical Engineering, vol. 72, no. 2, 57-72, DOI: 10.2478/scjme-2022-0016
- Thinh, H. X., Mai, N. T. (2023). Comparison of two methods in multi-criteria decision-making: application in transmission rod material selection. EUREKA: Physics and Engineering, no. 6, 59-68, DOI: 10.21303/2461-4262.2023.003046
- Petrović, G., Mihajlović, J., Ćojbašić, Ž., Madić, M., Marinković, D. (2019). Comparison of three fuzzy MCDM methods for solving the supplier selection problem. Facta Universitatis, Series: Mechanical Engineering, vol. 17, no. 3, 455-469, DOI: 10.22190/FUME190420039P
- Mehdi, K. G., Abdolghani, R., Maghsoud, A., Zavadskas, E. K., Antuchevičienė, J. (2024). Multi-Criteria personnel evaluation and selection using an objective pairwise adjusted ratio analysis (OPARA). Economic Computation and Economic Cybernetics Studies and Research, vol. 58, no. 2, 23-45, DOI: 10.24818/18423264/58.2.24.02
- Mai, N. T. (2025). Hybrid multi-criteria decision making methods: combination of preference selection index method with faire un choix adèquat, root assessment method, and proximity indexed value. Engineering, Technology & Applied Science Research, vol. 15, no. 1, 19086-19090, DOI: 10.48084/etasr.9325
- Sotoudeh-Anvari, A. (2023). Root assessment method (RAM): A novel multi-criteria decision making method and its applications in sustainability challenges. Journal of Cleaner Production, vol. 423, 138695, DOI: 10.1016/j.jclepro.2023.138695
- Baydaş, M. (2022). Comparison of the performances of MCDM methods under uncertainty: an analysis on bist SME industry index. OPUS Journal of Society Research, vol. 19, no. 46, 308-326, DOI: 10.26466//opusjsr.1064280
- Baydaş, M., Elma, O. E. (2021). An objectıve criteria proposal for the comparison of MCDM and weighting methods in financial performance measurement: An application in Borsa Istanbul. Decision Making: Applications in Management and Engineering, vol. 4, no. 2, 257-279, DOI: 10.31181/dmame210402257b
- Ceballos, B., Lamata, M. T., Pelta, D. A. (2016). A comparative analysis of multi-criteria decision-making methods. Progress in Artificial Intelligence, vol. 5, 315-322, DOI: 10.1007/s13748-016-0093-1
- Ghaleb, A. M., Kaid, H., Alsamhan, A., Mian, S. H., Hidri, L. (2020). Assessment and comparison of various MCDM approaches in the selection of manufacturing process. Advances in Materials Science and Engineering, vol. 2020, no. 1, 4039253, DOI: 10.1155/2020/4039253
- Güçlü, P. (2024). Comparative analysis of the MCDM methods with multiple normalization techniques: three hybrid models combine MPSI with DNMARCOS, AROMAN, and MACONT methods. Business and Economics Research Journal, vol. 15, no. 2, 129-154, DOI: 10.20409/berj.2024.436
- Hodgett, R. E. (2016). Comparison of multi-criteria decision-making methods for equipment selection. The International Journal of Advanced Manufacturing Technology, vol. 85, 1145-1157, DOI: 10.1007/s00170-015-7993-2
- Thor, J., Ding, S. H., Kamaruddin, S. (2013). Comparison of multi criteria decision making methods from the maintenance alternative selection perspective. The International Journal of Engineering and Science, vol. 2, no. 6, 27-34.
- Casals, L. C., Martinez-Laserna, E., García, B. A., Nieto, N. (2016). Sustainability analysis of the electric vehicle use in Europe for CO2 emissions reduction. Journal of Cleaner Production, vol. 127, 425-437.
- Sudha, S., Edwin, D. F., Nivetha, M. (2023). Integrated Machine Learning Algorithms and MCDM Techniques in Optimal Ranking of Battery Electric Vehicles. In E3S Web of Conferences (Vol. 405, p. 02005). EDP Sciences.
- Ecer, F. (2021). A consolidated MCDM framework for performance assessment of battery electric vehicles based on ranking strategies. Renewable and Sustainable Energy Reviews, vol. 143, 110916, DOI: 10.1016/j.rser.2021.110916
- Tian, Z. P., Liang, H. M., Nie, R. X., Wang, X. K., Wang, J. Q. (2023). Data-driven multi-criteria decision support method for electric vehicle selection. Computers & Industrial Engineering, vol. 177, 109061.
- Ren, X., Sun, S., Yuan, R. (2021). A study on selection strategies for battery electric vehicles based on sentiments, analysis, and the MCDM model. Mathematical Problems in Engineering, vol. 2021, no. 1, 9984343, DOI: 10.1155/2021/9984343
- Bošković, S., Švadlenka, L., Jovčić, S., Dobrodolac, M., Simić, V., Bacanin, N. (2023). An alternative ranking order method accounting for two-step normalization (AROMAN)—A case study of the electric vehicle selection problem. IEEE Access, vol. 11, 39496-39507, DOI: 10.1109/ACCESS.2023.3265818
- Pradhan, P., Shabbiruddin, Pradhan, S. (2022). Selection of electric vehicle using integrated Fuzzy-MCDM approach with analysis on challenges faced in hilly terrain. Energy Sources, Part A: Recovery, Utilization, and Environmental Effects, vol. 44, no. 2, 2651-2673, DOI: 10.1080/15567036.2022.2056665
- Dwivedi, P. P., Sharma, D. K. (2023). Evaluation and ranking of battery electric vehicles by Shannon’s entropy and TOPSIS methods. Mathematics and Computers in Simulation, vol. 212, 457-474, DOI: 10.1016/j.matcom.2023.05.013
- Biswas, S., Sanyal, A., Božanić, D., Kar, S., Milić, A., Puška, A. (2023). A multicriteria-based comparison of electric vehicles using q-rung orthopair fuzzy numbers. Entropy, vol. 25, no. 6, 905, DOI: 10.3390/e25060905
- Çakır, E., Taş, M. A., & Ulukan, Z. (2021, October). Neutrosophic fuzzy MARCOS approach for sustainable hybrid electric vehicle assessment. In 2021 IEEE International Conference on Systems, Man, and Cybernetics (SMC) (pp. 3423-3428). IEEE.
- Das, M. C., Pandey, A., Mahato, A. K., & Singh, R. K. (2019). Comparative performance of electric vehicles using evaluation of mixed data. Opsearch, vol. 56, 1067-1090, DOI: 10.1007/s12597-019-00398-9
- Golui, S., Mahapatra, B. S., & Mahapatra, G. S. (2024). A new correlation-based measure on Fermatean fuzzy applied on multi-criteria decision making for electric vehicle selection. Expert Systems with Applications, vol. 237, 121605, DOI: 10.1016/j.eswa.2023.121605
- Puška, A., Stojanović, I., Štilić, A. (2023). The influence of objective weight determination methods on electric vehicle selection in urban logistics. Journal of Intelligent Management Decision, vol. 2, no. 3, 117-129, DOI: 10.56578/jimd020302
- Biswas, T. K., Das, M. C. (2019). Selection of commercially available electric vehicle using fuzzy AHP-MABAC. Journal of The Institution of Engineers (India): Series C, vol. 100, 531-537, DOI: 10.1007/s40032-018-0481-3
- Khan, F., Ali, Y., Khan, A. U. (2020). Sustainable hybrid electric vehicle selection in the context of a developing country. Air Quality, Atmosphere & Health, vol. 13, 489-499, DOI: 10.1007/s11869-020-00812-y
- Więckowski, J., Wątróbski, J., Kizielewicz, B., Sałabun, W. (2023). Complex sensitivity analysis in Multi-Criteria Decision Analysis: An application to the selection of an electric car. Journal of Cleaner Production, vol. 390, 136051, DOI: 10.1016/j.jclepro.2023.136051
- Görçün, Ö. F., Simic, V., Kundu, P., Özbek, A., Küçükönder, H. (2024). Electric vehicle selection for industrial users using an interval-valued intuitionistic fuzzy COPRAS-based model. Environment, Development and Sustainability, 1-42,DOI: 10.1007/s10668-024-05562-w
- Štilić, A., Puška, A., Đurić, A., Božanić, D. (2022). Electric vehicles selection based on brčko district taxi service demands, a multi-criteria approach. Urban Science, vol. 6, no. 4, 73, DOI: 10.3390/urbansci6040073
- Poongothai, P., Nandakumar, C. D., Ponnusamy, R. (2023, December). Decision-Making for Electric Vehicle Selection Using AHP-MABAC-Fuzzy Integration. In 2023 International Conference on Data Science, Agents & Artificial Intelligence (ICDSAAI) (pp. 1-5). IEEE.
- Giang, N. T., & Thinh, H. X. (2025). Comparing Subjective Weighting Methods in Multi-Criteria Decision-Making: An Application to Electric Bicycle Ranking. Engineering, Technology & Applied Science Research, 15(2), 21963-21969.
- Puška, A., Božanić, D., Mastilo, Z., & Pamučar, D. (2023). Extension of MEREC-CRADIS methods with double normalization-case study selection of electric cars. Soft Computing, 27(11), 7097-7113.
- [Dimic-Misic, K., singh Chouhan, S., Brkić, V. S., & Gasik, M. (2025). Recycling or Sustainability: The Road of Electric Vehicles Towards Sustainable Economy via Blockchain, Recycling, 10, 48.
- Gligorić, Z., Gligorić, M., Miljanović, I., Lutovac, S., Milutinović, A. (2023). Assessing Criteria Weights by the Symmetry Point of Criterion (Novel SPC Method)--Application in the Efficiency Evaluation of the Mineral Deposit Multi-Criteria Partitioning Algorithm, Computer Modelling in Engineering & Scicences, vol.136, no.1, 955-979, DOI: 10.32604/cmes.2023.025021
- Keshavarz-Ghorabaee, M., Amiri, M., Zavadskas, E. K., Turskis, Z., Antucheviciene, J. (2021). Determination of objective weights using a new method based on the removal effects of criteria (MEREC). Symmetry, vol. 13, no. 4, 525, DOI: 10.3390/sym13040525
- Zavadskas, E. K., Podvezko, V. (2016). Integrated determination of objective criteria weights in MCDM. International Journal of Information Technology & Decision Making, vol. 15, no. 02, 267-283, DOI: 10.1142/S0219622016500036
- Ciardiello, F., Genovese, A. (2023). A comparison between TOPSIS and SAW methods. Annals of Operations Research, vol. 325, no. 2, 967-994, DOI: 10.1007/s10479-023-05339-w
- Mukaka, M. M. (2012). A guide to appropriate use of correlation coefficient in medical research. Malawi medical journal, vol. 24, no. 3, 69-71.
- Shekhovtsov, A. (2021). How strongly do rank similarity coefficients differ used in decision making problems?. Procedia Computer Science, vol. 192, 4570-4577, DOI: 10.1016/j.procs.2021.09.235
- Pinto da Costa, J., Soares, C. (2005). A weighted rank measure of correlation. Australian & New Zealand Journal of Statistics, vol. 47, no. 4, 515-529, DOI: 10.1111/j.1467-842X.2005.00413.x
- Genest, C., Plante, J. F. (2003). On Blest's measure of rank correlation. Canadian Journal of Statistics, vol. 31, no. 1, 35-52, DOI: 10.2307/3315902
- Biswas, S., Pamucar, D., Dawn, S., Simic, V. (2024). Evaluation based on relative utility and nonlinear standardization (ERUNS) method for comparing firm performance in energy sector. Decision Making Advances, vol. 2, no. 1, 1-21, DOI: 10.31181/dma21202419
Conflict of Interest Statement
All authors declare that they have no conflicts of interest
Author Contributions
Data Availability Statement
The data presented in this study are available on request from the corresponding author.
Supplementary Materials
No supplementary materials are provided with this manuscript.