Volume 24 number 1 article 1323 pages: 156-167
Received: Mar 20, 2025 Accepted: Dec 08, 2025 Available Online: Jan 08, 2026 Published: Mar 02, 2026
DOI: 10.5937/jaes0-57665
EVALUATING AND RANKING SERVICE QUALITY ATTRIBUTES FOR OPTIMIZING METRO RAIL TRANSIT SERVICES IN DHAKA USING ADVANCED ANALYTICS
Abstract
As Dhaka embraces its first Mass Rapid Transit (MRT) system, understanding what drives users’ satisfaction has become crucial for shaping its success. This study examines the service quality (SQ) of MRT Line-6, identifying and prioritizing the factors that influence user perceptions of this transformative transit solution. Using advanced machine learning models such as Random Forest Classifier, Support Vector Machine, and CART, alongside statistical methods like Probit, Ordered and Multiple Linear Regression, the research provides a robust analysis of twenty-nine (29) SQ indicators. Random Forest Classifier emerged as the most effective model, achieving 88.21% accuracy and offering valuable insights into the interrelationships of key attributes, including inclusive service performance, customer loyalty, switching cost from other transportation mode, ticket affordability, performance of ticketing system, and feeder service costs. Survey results highlight that most users around 60% switched from buses to MRT for its comfort and reliability. The findings emphasize the need to enhance affordability, accessibility, overall comfort and feeder services while promoting digital ticketing through options like Rapid Pass and online platforms. These actionable insights offer a roadmap for policymakers and urban planners to optimize MRT services, aligning with global best practices to support sustainable urban mobility in Dhaka and beyond.
Highlights
- Machine Learning approaches captured complex user perceptions better than traditional statistical models.
- Random Forest achieved the strongest performance, accurately predicting MRT service quality.
- Insights offer clear priorities for improving affordability, feeder access, and overall commuter comfort in built-up areas.
- Inclusive service performance and customer loyalty emerged as the most influential satisfaction drivers.
Keywords
Content
1 Introduction
Public transportation is a vital component of urban mobility, offering substantial benefits that enhance the functionality, sustainability, and livability of cities. Among the various public transport modes, mass rapid transit (MRT) systems serve as a backbone in megacities, efficiently addressing urban congestion and enabling economic growth. In the context of Dhaka, the capital of Bangladesh, improving the transportation system has become essential to reduce chronic traffic congestion and support the city’s expanding economy. The successful integration and operation of MRT systems can significantly shift travel behavior by providing a reliable and attractive alternative to private vehicles.
To maintain and enhance public transit usage, operators must consistently monitor performance and service quality (SQ), which is widely recognized as a key performance indicator in transportation engineering [1, 2]. SQ reflects users’ perceptions and is crucial for attracting and retaining commuters as public transport services are delivered directly to passengers and their perceptions ultimately define the quality of the service [3]. The measurable features upon which SQ is assessed are termed SQ attributes, and investments in improving these attributes play a central role in boosting efficiency, safety, accessibility, and user satisfaction.
However, modeling service quality poses significant challenges due to its multidimensional nature, perception variability, and the often-imprecise nature of survey-based data. Traditional parametric approaches like regression and logistic regression assume linear relationships and fixed parameters, which may not capture the complexity of user satisfaction. Non-parametric models offer greater flexibility by assigning random parameters based on data patterns [4]. More recently, machine learning (ML) methods have gained prominence for their ability to handle both qualitative and quantitative data effectively [5], including artificial neural networks [6], decision trees [7], and statistical models like logit and multinomial regression [8].
Despite their growing potential, machine learning models have rarely been applied to assess the perceived service quality of newly introduced MRT systems, particularly in developing and data-constrained urban contexts. This study addresses that gap by evaluating commuter perceptions of Dhaka’s newly operational MRT Line-6 using both traditional regression and multiple machine learning models. By identifying the most effective approach and ranking key service attributes based on their predictive influence, the research offers data-driven, early-stage insights to support evidence-based service improvement strategies and contributes to the broader discourse on user-centric transit planning in emerging cities.
1.1 Literature review
Traditional service quality models primarily assess comfort, safety, and reliability to determine public transport efficiency essential for the sustainability and adaptability of new transit systems. Previous studies on service quality have focused on relevant infrastructure and design improvements aimed at increasing efficiency and reducing dwell time, such as the application of social force models for passenger behavior [10] and the serviceability of public transit considering dwell time and headway [11].
The investigation of service quality (SQ) factors that influence consumer behavior and the assessment of their relative significance are essential for enhancing public transport services. In this regard, two distinct categories of methods for measuring service quality and customer satisfaction have been identified [12]. The first category encompasses statistical analysis techniques aimed at evaluating individual service attributes or establishing their relationship with overall customer satisfaction. These techniques include quadrant and gap analysis, factor analysis, scatter plots, cluster analysis, and others. The second category consists of model-based approaches that estimate the influence of service attributes through methods such as structural equation modeling (SEM), regression analysis, logit models, and artificial neural network models.
Passenger satisfaction can be evaluated by comparing expectations (what customers anticipate) and perceptions (what they experience) of a service [13]. Tools like the SERVQUAL method measure the gap between these in five universal service quality dimensions [14]. Additionally, the Kano model introduces indexes such as Better, Worse, and Quality Improvement for quality evaluation [15]. The Customer Satisfaction Index (CSI) has also been developed using significance weighting [16].
Several studies have applied statistical and machine learning methods to assess public transport satisfaction. Factor analysis and regression have been used to examine bus service satisfaction [17], while similar techniques have been applied to model railway transit satisfaction [18]. Structural equation modeling has been employed to evaluate paratransit services in Dhaka [19]. Artificial neural network approaches have been compared for predicting bus service quality [20], and an Adaptive Neuro-Fuzzy Inference System (ANFIS) has been used to analyze commuter train perceptions [21].
Studies have also explored the connection between service quality, satisfaction, and passenger loyalty. Structural equation modeling has been used to investigate behavioral intentions [22], and the impact of service quality on consumer loyalty has been examined [23]. The role of satisfaction in fostering loyalty has been emphasized [24]. Additionally, accessibility and service quality have been linked to satisfaction [25, 26]. Partial least squares structural equation modeling (PLS-SEM) has been used to study factors affecting satisfaction and reuse intentions, particularly for the Kuala Lumpur monorail [27].
Recent advancements in machine learning (ML) and statistical modeling have significantly reshaped how service quality and customer satisfaction in public transportation are evaluated and predicted. A wide range of studies have explored both traditional regression techniques and advanced ML algorithms to better understand public transport dynamics and enhance service delivery [28]. Techniques such as Support Vector Machines (SVM), k-Nearest Neighbors (KNN), and Decision Trees have been successfully employed to forecast metro ridership, incorporating factors like the surrounding built environment. Structural Equation Modeling (SEM) has also been used to dissect and analyze the interrelationships among various service quality components, often through multiple regression frameworks.
To improve prediction accuracy and model performance, several researchers have adopted hybrid variable selection strategies. These typically involve a two-stage process, first applying filter methods to reduce dimensionality, followed by wrapper methods like Recursive Feature Elimination (RFE) to select the most relevant features [29]. The performance of these models is often benchmarked using classifiers such as Random Forest or SVM-RFE to evaluate classification accuracy and interpretability.
Despite these advancements, there remains a notable gap in applying such machine learning techniques to newly introduced metro systems in developing countries, particularly during their formative operational phase. Existing studies have largely focused on established transit systems with mature datasets, overlooking the critical insights that early-stage user feedback can provide. This study addresses this gap by applying and comparing both traditional and machine learning approaches to evaluate commuter perception of Dhaka’s newly operational MRT Line-6. By focusing on real-world perceptions during the system’s initial implementation period, the study offers timely and actionable insights for enhancing service quality and supporting long-term ridership growth in resource-constrained urban environments.
2 Materials and methods
The methodological workflow outlines the systematic approach used to conduct the research, detailing each step from initial planning to final analysis. A comprehensive overview of the methodology is provided below.
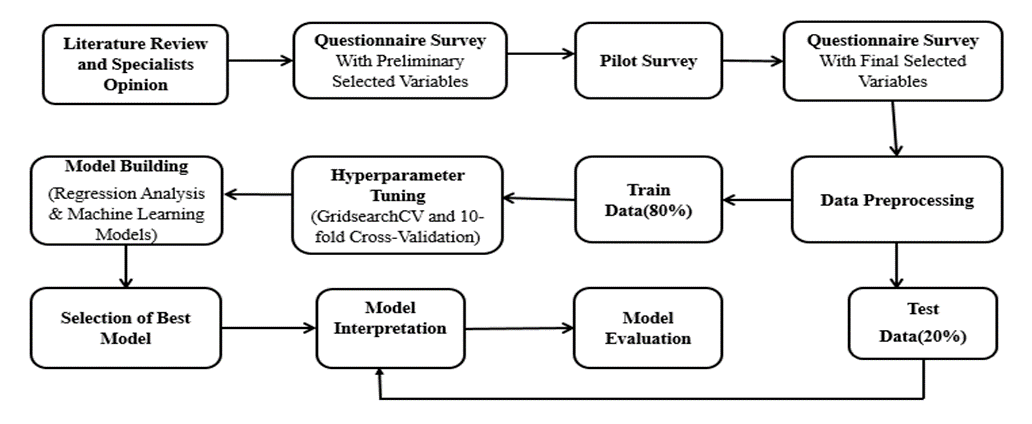
Fig. 1. Methodological Workflow
A diagram of methodological workflow of this study is depicted in Figure 1. The study corridor for this research focuses on the operational MRT Line 6 in Dhaka. Initially, preliminary variables for the questionnaire survey are selected based on an extensive literature review and expert opinions. This is followed by a pilot survey to refine these variables for the final data collection. Once the questionnaire form is finalized, data is collected from nine operational metro stations. Data preprocessing is then conducted to prepare the data for analysis including descriptive statistics performed based on respondents' perceptions. In the modeling phase, the most influential variables are selected. This was followed by grid search cross-validation with train and test data ratio of 80:20 for hyper-parameter tuning to enhance model performance. Regression models and machine learning models, i.e., RF, SVM and CART, are used for data analysis, with the models run using the selected variables. The best model, based on accuracy, is then identified and thoroughly interpreted. Simultaneously, the model is evaluated to determine if the selected variables adequately explain it.
2.1 Questionnaire design
The survey's questionnaire is divided into two sections. The first section aims to gather general information about the passenger, including date of the interview, name of the boarding and alighting station, the demographics, i.e., gender, age, income and occupation of the respondents and the travel characteristics, i.e., purpose of travelling, reason behind choosing MRT, previous mode of transportation etc. The second segment focused on gathering rider’s feedback regarding the perceived value of the chosen service characteristics. Respondents were questioned on twenty-nine (29) service quality indicators with answer options on a Likert scale (Very poor, Poor, Average, Good, and Excellent) in order to learn how passengers felt about them. The ordinal scale from 1 to 5 was used to rank this scale. The respondents provided their ratings based on their most recent MRT journey, helping to anchor their feedback in specific, recent experiences. This approach was adopted to reduce recall bias and enhance the accuracy of perception-based responses. The questionnaire was administered using the KOBO Toolbox platform, which supports both online self-completion and offline face-to-face interviews conducted at MRT stations [30].
2.2 Machine learning algorithms for SQ analysis
In conventional statistical modelling, regression algorithms are used to predict continuous numerical values of a target variable based on given input data, as expressed in Equation (2).
| $Y = β_0+ β_1 X_1+ ⋯+ β_n X_n$ | (1) |
Among the widely utilized supervised machine learning algorithms, Random Forest stands out as an ensemble learning method that integrates multiple decision trees, each trained on different subsets of the input dataset. These individual trees generate predictions independently, and the final output is determined through majority voting. The impurity of nodes within Random Forest models is typically assessed using measures such as Entropy, Gini Index, or Mean Squared Error (MSE), depending on whether the task is classification or regression [31]. Decision Tree (DT) algorithms are also extensively applied for both classification and regression problems. A decision tree is constructed by selecting an initial decision node and recursively partitioning the dataset based on splitting criteria such as information gain, entropy, or Gini Index, continuing this process until optimal terminal nodes are achieved. Feature importance is measured using Gini Importance, which quantifies the average reduction in node impurity (Gini Index) whenever a feature is used for splitting across all trees. The resulting values are normalized to sum to one.
To evaluate the performance of these models, standard classification metrics such as accuracy, precision, recall, and F1-score are used, based on the confusion matrix. This matrix summarizes model predictions by counting true positives, false positives, true negatives, and false negatives. Accuracy refers to the proportion of all correct predictions—both positive and negative—out of the total number of cases [32]. Precision measures how many of the instances predicted as positive were actually correct. Recall indicates how well the model captures all actual positive cases. The F1-score combines both precision and recall into a single measure by calculating their harmonic mean, providing a balanced evaluation when there is a trade-off between the two [33]. Together, these metrics offer a comprehensive assessment of the model's reliability and effectiveness across different classification scenarios.
3 Results and discussion
This study evaluates the performance of the MRT Line-6 service in Dhaka, spanning from Agargaon to Uttara North Metro Station, by collecting data through a meticulously designed questionnaire survey. The data collection was conducted from July to September 2023 using both online and offline approaches via the KOBO Toolbox platform. In-person interviews were held with passengers traveling on MRT Line-6 or waiting at the concourse and platform areas. Despite an initial goal of 1,500 data points, the study successfully gathered 1,397 samples, accounting for challenges such as passenger reluctance, urgency to secure seats, and unforeseen circumstances. Efforts were made to ensure a balanced representation of MRT users across key demographic and travel characteristics, including gender, age group, profession, income level, and trip purpose. Data was collected across multiple stations and time periods to capture a wide range of user experiences and minimize demographic or temporal bias.
Table 1. Preliminary statistics of sample data
|
Sl |
Attributes |
Factors |
Minimum / |
Mean |
Std. Deviation |
Description of variables |
|
1 |
On Time Performance |
Metro Service Efficiency |
(3,5) |
4.29 |
0.652 |
The percentage of trips arriving and departing within a certain threshold of the scheduled time |
|
2 |
Frequency of MRT |
(3,5) |
4.13 |
0.523 |
Time duration between two metro arrivals |
|
|
3 |
Dwelling Time MRT Coach |
(3,5) |
4.09 |
0.587 |
Waiting time incurred due to passengers boarding and alighting |
|
|
4 |
Seat Availability |
Passenger Service Experience
|
(3,5) |
4.05 |
0.673 |
Possibility of getting seat while travelling |
|
5 |
Travel Time Reduction by MRT |
(3,5) |
4.39 |
0.704 |
Travel time savings compared to other modes |
|
|
6 |
Security Against Rain/Storm |
(3,5) |
4.07 |
0.604 |
Passengers perception of weather protection facilities |
|
|
7 |
Air-conditioning and Ventilation |
(2,5) |
3.49 |
0.781 |
Air conditioning and ventilation system in concourse and platform |
|
|
8 |
Waiting Place Condition |
(2,4) |
3.01 |
0.763 |
Perception of adequacy, cleanliness of waiting place in concourse and platform |
|
|
9 |
Toilet Facility |
(3,5) |
4.17 |
0.665 |
Toilet facility in concourse and platform |
|
|
10 |
Noise Problem |
(3,5) |
3.75 |
0.725 |
Disturbance due to noise in concourse and platform area and while travelling |
|
|
11 |
Display of Necessary Information |
(3,5) |
4.23 |
0.582 |
Display of necessary time schedule and information at concourse and platform |
|
|
12 |
Crowd Management |
(2,5) |
3.49 |
0.692 |
Perception of how crowds are managed at concourse and platform |
|
|
13 |
Staff Behavior |
(3,5) |
4.11 |
0.587 |
Behavior and courtesy of officials and staffs |
|
|
14 |
Women Safety |
(3,5) |
4.18 |
0.598 |
Safety against women harassment in MRT coaches |
|
|
15 |
Overall Security |
(3,5) |
4.21 |
0.601 |
Overall safety and security at concourse, platform and MRT coaches |
|
|
16 |
Cleanliness of Concourse |
(3,5) |
4.36 |
0.591 |
Cleanliness and hygiene of concourse and platform |
|
|
17 |
Regular Maintenance |
(3,5) |
4.25 |
0.613 |
Regular maintenance and upkeep of concourse and platform |
|
|
18 |
Overall Comfort |
(3,5) |
3.87 |
0.673 |
Overall comfort level at concourse and platform |
|
|
19 |
Performance of ATS |
Affordability & Accessibility |
(3,5) |
3.99 |
0.691 |
Perception of reliability and efficiency of Electronic Self Ticketing System |
|
20 |
Performance of MTS |
(2,5) |
3.49 |
0.834 |
Perception of reliability and efficiency of manual ticketing system at concourse |
|
|
21 |
Adequacy of Feeder Service |
(1,4) |
2.74 |
0.966 |
Passenger perception of feeder service availability, sufficiency, and integration to ensure last-mile connectivity with MRT stations. |
|
|
22 |
Feeder Service Cost |
(1,4) |
2.54 |
0.918 |
Passengers’ affordability of cost to reach the metro station |
|
|
23 |
Footpath Condition Near MRT |
(3,5) |
3.65 |
0.685 |
Footpath condition to reach into metro station |
|
|
24 |
Lighting Near MRT Station |
(3,5) |
4.10 |
0.516 |
Adequacy of Lighting under MRT station |
|
|
25 |
Access Control |
(2,5) |
3.76 |
0.667 |
Access control at entry and exit gate |
|
|
26 |
MRT Ticket Fare |
(2,5) |
3.49 |
0.837 |
Satisfaction about ticket affordability, fairness |
|
|
27 |
Customer Loyalty |
(3,5) |
4.19 |
0.496 |
Willingness to recommend for using metro |
|
|
28 |
Inclusive Service Performance |
(3,5) |
4.07 |
0.532 |
Passenger perception of how inclusive MRT services are for vulnerable groups, including elderly, disabled, and low-income commuters. |
|
|
29 |
Switching Cost Comparison |
(1,5) |
2.61 |
1.378 |
Passenger perception of monetary costs involved in transfers between feeder modes and MRT compared to other modes. |
A total of 29 SQ indicators were further grouped into three factors and these factors reflect the underlying themes represented by the associated attributes or variables [34]. During data pre-processing, it was observed that responses exhibited a significant positive skewness, as most users rated their experiences highly, reflecting initial satisfaction with the newly introduced service as shown in Table 1. This skewness necessitated re-categorization and reclassification of the dataset to ensure balanced distribution and improve model performance. To address this, the dataset underwent preprocessing to mitigate anomalies, making it suitable for subsequent analysis. These efforts were vital for maintaining the accuracy and reliability of the modeling process, which aimed to evaluate and enhance the quality of MRT services in Dhaka.
3.1 Model development and result interpretation
3.1.1 Regression analysis
Logistic regression models estimate the log odds of the outcome occurring versus the log odds of the outcome not occurring for a given independent variable. These log odds ratios are functions of the probabilities.
| $L_n = \ln\left(\frac{p_i}{1 - p_i}\right)$ | (2) |
The logit model solves problems in Eq. (3) and Eq. (4):
| $\ln\!\left(\frac{p_i}{1 - p_i}\right) = \alpha + \beta x + \varepsilon$ | (3) |
| $\frac{p_i}{1 - p_i} = \exp\!\bigl[\alpha + \beta x + \varepsilon\bigr]$ | (4) |
Where:
- Pi = Probability of an outcome event (overall satisfaction)
- 𝛼 = Intercept
- 𝛽 = Estimated coefficient
- 𝑥 = Independent variable (attitudinal scores towards reliability, in-vehicle environment, comfort and convenience, and environmental impact)
- 𝑒 = Error term
Ordinal Logistic Regression (OLR) is an extension of logistic regression when there is an ordered outcome variable. In OLR, log odds ratios are calculated for the independent variable just as in logistic regression and are also calculated for the intercept of each level of the outcome variable. Equation (5) illustrates the general logit regression model:
| $\text{Logit}(p) = \ln\!\left(\frac{p}{1-p}\right)$ | (5) |
3.2 Fitness criterion of different regression analysis
This study utilized three regression models (Ordinal Logistic Regression, Ordered Probit Regression, and Multinomial Logistic Regression) to analyze the overall perceived service quality (SQ) of MRT Line-6 in Dhaka. The comparative performance of these models was assessed using key indicators such as the Akaike Information Criterion (AIC), Bayesian Information Criterion (BIC), and the coefficient of determination (R²). Among these, Ordinal Logistic Regression was identified as the most suitable model based on its lower AIC and BIC values, indicating better model efficiency. However, Multinomial Logistic Regression achieved the highest R² value of 0.4631, suggesting a relatively better fit compared to the other models.
Table 2. Comparison of Different Regression Models
|
Model / Parameter |
R2 |
AIC |
BIC |
|
Ordered/Ordinal Logistic Regression |
0.4464 |
1195.553 |
1358.058 |
|
0.4397 |
1209.437 |
1371.941 |
|
|
Multinomial Logistic Regression |
0.4631 |
1219.537 |
1534.062 |
Despite these findings in Table 2, the R² values for all three traditional regression models (0.4464, 0.4397, and 0.4631) indicate a lack of strong predictive power, reflecting the challenges of applying conventional regression techniques to analyze perceived SQ in this context. This suggests that the inherent complexity and heterogeneity of passenger perceptions, coupled with the skewed nature of the data, limit the applicability of these statistical models. These limitations highlight the need for more flexible and robust methodologies, such as machine learning algorithms, to capture the intricate relationships among SQ attributes and provide more reliable insights for enhancing MRT services in Dhaka. While traditional models provide coefficient-based interpretability, they often fall short in revealing complex patterns in user-driven datasets, especially when feature interactions are non-linear.
3.3 Machine learning model formulation
This study evaluates the perceived service quality (SQ) of Dhaka's MRT Line-6 based on passenger perceptions. The dataset comprises twenty-nine (29) input features reflecting various aspects of MRT services, including Metro Service Efficiency, Passenger Service Experience and Accessibility & Affordability to MRT. The output variable, "Service Quality (SQ)," represents the overall perception of the facilities provided, from entry to departure at metro stations. To optimize model performance, hyper-parameter tuning was conducted using the Grid-Search Cross Validation method. For the Random Forest (RF) model, the best hyper-parameters included 100 estimators, a Gini criterion, a maximum depth of 20, a minimum of 2 samples per leaf, and a minimum split of 2 samples. For the Support Vector Machine (SVM) model, optimal settings comprised a penalty parameter (C) of 1, a radial basis function (RBF) kernel, and an automatic gamma parameter. Similarly, for the Classification and Regression Tree (CART) model, the best parameters included a Gini criterion, a maximum depth of 10, a minimum of 4 samples per leaf, and a minimum split of 2 samples. These tuned parameters ensured the models were well-suited for capturing the complexities of the data and providing robust insights into MRT service quality.
3.4 Comparative analysis of different models
The study mainly focuses on using various machine learning algorithms to model the perceived service quality (SQ) of Mass Rapid Transit (MRT) system of Dhaka city. The algorithms explored in the study include:
C4.5 Decision Tree Algorithm: This is used to predict customer satisfaction levels in MRT systems, focusing on service and facility features. It has an accuracy of 82.86%, with the most influential features being 'Inclusive Service Performance', 'Switching Cost Comparison', and 'Customer Loyalty'.
Classification and Regression Tree (CART): Classification and Regression Tree (CART) model specifically a more effective Decision Tree Classifier than C4.5 is also applied to predict customer satisfaction in Mass Rapid Transit (MRT) systems. This model achieved an accuracy of 83.57%, and a detailed analysis of feature importance based on Gini impurity was conducted. The most influential features found from Gini Index include 'Inclusive Service Performance', 'Customer Loyalty', and 'Switching Cost Comparison'.
Support Vector Machine (SVM) Modeling: SVM was employed with an accuracy of 86.07%. The most significant features impacting SQ include 'Customer Loyalty', 'Inclusive Service Performance', 'Access Control', and 'Cleanliness of Concourse'.
Random Forest Modeling: This method demonstrated an accuracy of 88.21%, with significant predictors being 'Inclusive Service Performance', 'Customer Loyalty', and 'Switching Cost Comparison'. It is especially effective in distinguishing between moderate and high levels of service quality.
Figure 2 presents a comparative evaluation of the four machine learning models used in this study—Random Forest, Support Vector Machine (SVM), Classification and Regression Tree (CART), and C4.5—based on accuracy, precision, recall, and F1-score. Among these, Random Forest achieved the highest performance across all metrics. Its integration of ensemble learning with feature selection using the Gini Index enabled it to rank key service quality attributes effectively, offering a data-driven approach to understanding which factors most strongly shape commuter perceptions.
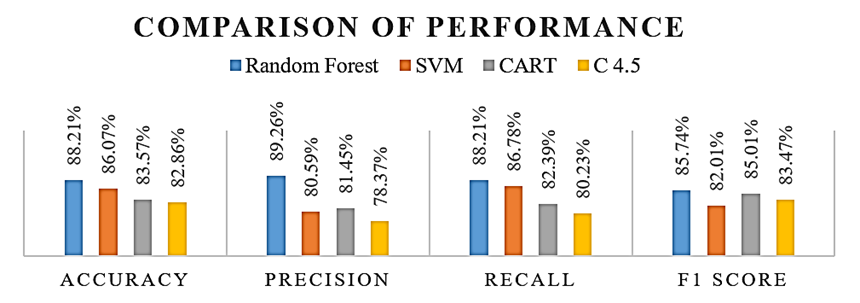
Fig. 2. Comparison of different ML algorithms
The findings highlight the Random Forest Classifier’s strength in predicting MRT service quality, particularly in differentiating between moderate and high levels of service. Its high accuracy and precision scores underscore its effectiveness in capturing the intricate relationships among service quality indicators. By leveraging this model, transportation authorities can gain actionable insights into key factors influencing user satisfaction, paving the way for data-driven improvements in MRT services. This makes the Random Forest Classifier not only a powerful analytical tool but also a practical resource for enhancing urban transit systems.
3.5 Attribute ranking
Figure 3 illustrates the feature importance of various factors influencing service quality (SQ), as determined by the Gini Index derived from the Random Forest model. Among the evaluated attributes, 'Inclusive Service Performance' emerged as the most significant predictor, highlighting its critical role in shaping overall perceptions of MRT service quality. For instance, including facilities for all the passengers on the MRT can lead to increased ridership [35]. This is followed by 'Customer Loyalty' and 'Switching Cost Comparison,' which also demonstrate strong importance in the model, underscoring their influence on passenger satisfaction.
Conversely, factors such as 'Cleanliness of Concourse,' 'Women Safety,' and 'Regular Maintenance' were ranked lower in importance, indicating a relatively lesser impact on the model's predictions. While these attributes contribute to the overall service quality, their influence appears less critical compared to the top-ranking predictors. These insights provide a clear understanding of the hierarchical significance of various service attributes, enabling policymakers and transit authorities to prioritize improvements in areas that most strongly affect passenger satisfaction.
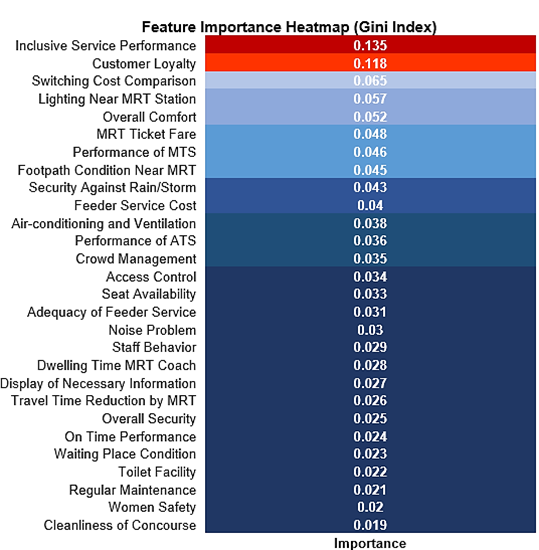
Fig. 3. Feature importance based on random forest gini index
3.6 Comparison of attribute ranking
The ranking of service quality (SQ) might change depending on the methodologies and surveys used to evaluate them. Table 3 shows a quick rundown of the priority ranking of the top ten (10) significant attributes from the most efficient three Machine Learning (ML) algorithms used in this study.
Table 3. Comparison of top 10 attribute ranking by random forest classifier, SVM and CART
|
Rank |
Random Forest Classifier |
Support Vector Machine (SVM) |
CART |
|
1 |
Inclusive Service Performance |
Customer Loyalty |
Inclusive Service Performance |
|
2 |
Customer Loyalty |
Inclusive Service Performance |
Customer Loyalty |
|
3 |
Switching Cost Comparison |
Access Control |
Switching Cost Comparison |
|
4 |
Lighting Near MRT Station |
Cleanliness of Concourse |
MRT Ticket Fare |
|
5 |
Overall Comfort |
Display of Necessary Information |
Dwelling Time MRT Coach |
|
6 |
MRT Ticket Fare |
Feeder Service Cost |
Overall Comfort |
|
7 |
Performance of MTS |
Regular Maintenance |
Performance of MTS |
|
8 |
Footpath Condition Near MRT |
Security Against Rain/Storm |
Regular Maintenance |
|
9 |
Security Against Rain/Storm |
MRT Ticket Fare |
Air-conditioning and Ventilation |
|
10 |
Feeder Service Cost |
Travel Time Reduction by MRT |
Waiting Place Condition |
A bar chart is further created to demonstrate the comparison of the top ten attributes with their feature ranking. This bar chart in Figure 4 visualizes and compares the relative importance of features across three machine learning (ML) models: Random Forest Classifier, Support Vector Machine (SVM), and CART. The x-axis represents the Rank (1 to 10) of feature importance, while the y-axis indicates the Relative Importance (expressed as bubble sizes for clarity and significance). It allows for a direct comparison of how each model prioritizes different features in predicting outcomes.
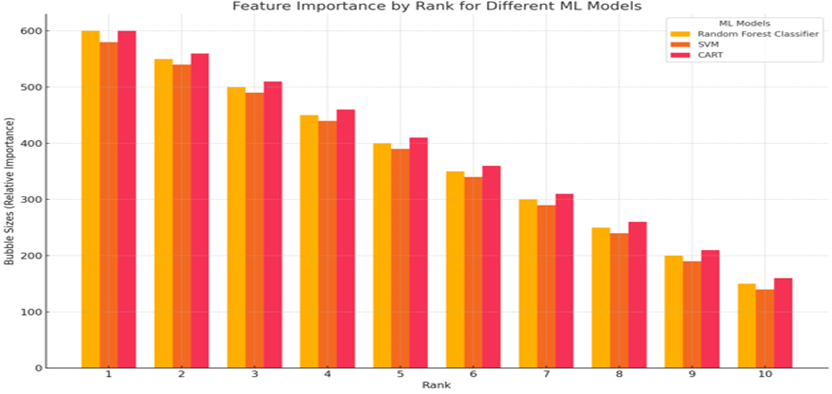
Fig. 4 Feature importance by rank for different ML models
Each group of bars in Figure 5 compares the importance of features for the three ML models.
Top Features (Ranks 1–3):
Inclusive Service Performance consistently emerges as the most critical feature for Random Forest and CART, indicating its universal importance across models. SVM, however, prioritizes Customer Loyalty as Rank 1, suggesting its strong influence in this model.
Mid-Ranked Features (Ranks 4–7):
Features like Lighting near MRT Station, MRT Ticket Fare, and Overall Comfort are moderately important across all models. The SVM model uniquely highlights Display of Necessary Information (Rank 5) as significant, reflecting its distinct decision boundary.
Lower-Ranked Features (Ranks 8–10):
Features such as Security against Rain/Storm, Air-conditioning and Ventilation, and Waiting Place Condition hold less importance but remain relevant. Differences are observed where CART and SVM rank MRT Ticket Fare and Travel Time Reduction by MRT higher than Random Forest.
The Figure 4 effectively visualizes feature importance across three ML models. It also highlights universal and model-specific patterns, aiding in understanding which predictors are most influential for service quality assessments. A comparative analysis of the model ranking is summarized below:
Random Forest Classifier: Prioritizes general service quality (Inclusive Service Performance) and customer satisfaction (Customer Loyalty).
SVM: Focuses on features like Access Control and Maintenance, suggesting a structural influence on model predictions.
CART: Balances top-ranked features like Inclusive Service Performance while emphasizing environmental aspects like Air-conditioning and Ventilation.
4 Conclusions
This study applied both traditional statistical models and advanced machine learning algorithms to assess the perceived service quality (SQ) of Dhaka’s MRT Line-6, aiming to identify the key factors that shape user satisfaction. The findings revealed that conventional regression models, such as ordinal and multinomial logistic regression, demonstrated limited predictive power, highlighting their inadequacy in capturing the complex, nonlinear relationships inherent in service quality perception data. While traditional models provide coefficient-based interpretability, they often fall short in capturing complex patterns in user-driven datasets, particularly when feature interactions are non-linear or interdependent.
In contrast, the Random Forest Classifier significantly outperformed traditional models, achieving an accuracy of 88.21% and effectively modeling the intricate interdependencies among service quality attributes. It identified 'Inclusive Service Performance,' 'Customer Loyalty,' and 'Switching Cost Comparison' as the most critical factors influencing overall SQ, whereas aspects like 'Cleanliness of Concourse' and 'Women Safety' played a comparatively lesser role. This reinforces the value of machine learning techniques especially Random Forest Classifier (RFC) in delivering deeper and more actionable insights into public transport service assessment.
To enhance the quality of MRT Line-6, policymakers and transit authorities are encouraged to prioritize improvements in the most influential areas. Strengthening inclusive services, fostering customer loyalty, and addressing switching costs can substantially improve rider satisfaction. Enhancements such as more affordable and accessible feeder services, optimized ticket pricing and user-friendly digital solutions like Rapid Pass and online ticketing systems can further elevate the commuter experience. Furthermore, continuous monitoring using advanced machine learning models is recommended to adapt strategies to evolving passenger needs and ensure sustained improvements. These initiatives will not only elevate the quality of MRT services but also contribute to sustainable urban mobility in developing megacities like Dhaka. By focusing on a newly introduced MRT system in a developing context, this study offers an early-stage machine learning–based framework for evaluating user perceptions, contributing original insights at a critical phase of transit system development.
Acknowledgements
This research was supported by Bangladesh University of Engineering and Technology (BUET) under grant resolution No: 3(3); BPGS Meeting No: 3/2023 for data collection purposes only. No funding was provided for the publication process or any associated charges.
References
- TRB. (2010). Highway capacity manual. Transportation Research Board, Washington, D.C.
- Kadiyali, L. R. (2008). Traffic engineering and transport planning (6th ed.). Khanna Publishers.
- Das, S., & Pandit, D. (2013). Importance of user perception in evaluating level of service for bus transit for a developing country like India: A review. Transport Reviews, 33(4), 402–420. https://doi.org/10.1080/01441647.2013.789571
- Davies, G., Allen, M., & Wardman, M. (1999). Modeling passengers’ perceptions of train service quality. Transportation Research Part E: Logistics and Transportation Review, 35(4), 287–300.
- Mazzulla, G., & Eboli, L. (2006). A service quality model for the Italian railway transport. Transport Policy, 13(6), 357–365.
- Garrido, R. A., de Oña, R., & de Oña, J. (2014). Neural networks for analyzing service quality in public transportation. Transportation Research Part C: Emerging Technologies, 44, 142–153. https://doi.org/10.1016/j.eswa.2014.04.045
- Oña, J. de, Oña, R. de, Eboli, L., Forciniti, C., & Mazzulla, G. (2014). Transit passengers’ behavioral intentions: The influence of service quality and customer satisfaction. Transportmetrica: Transport Science, 12(5), 385–412. https://doi.org/10.1080/23249935.2016.1146365
- Dell’Olio, L., Ibeas, A., & Cecín, P. (2011). The quality of service desired by public transport users. Transport Policy, 18(1), 217–227. https://doi.org/10.1016/j.tranpol.2010.08.005
- Bi, H., Ye, Z., & Zhang, Y. (2021). Analysis of the integration usage patterns of multiple shared mobility modes and metro system. Transportation Research Record, 2675(10), 876–894. https://doi.org/10.1177/03611981211013351
- Fan, Y., Gao, L., Liu, Y., & Ji, Y. (2019). Modification and application of a social force model for bus passenger boarding and alighting behaviors (Report No. 19-00470).
- Mahdavilayen, M., Paquet, V., & He, Q. (2020). Using microsimulation to estimate effects of boarding conditions on bus dwell time and schedule adherence for passengers with mobility limitations. Journal of Transportation Engineering, Part A: Systems, 146(6), 04020046. https://doi.org/10.1061/JTEPBS.0000365
- Eboli, L., & Mazzulla, G. (2008). A stated preference experiment for measuring service quality in public transport. Transportation Planning and Technology, 31(5), 509–523. https://doi.org/10.1080/03081060802364471
- Parasuraman, A., Zeithaml, V. A., & Berry, L. L. (1990). Delivering quality service: Balancing customer perceptions and expectations. Free Press.
- Zeithaml, V. A., Berry, L. L., & Parasuraman, A. (1996). The behavioral consequences of service quality. Journal of Marketing, 60(2), 31–46. https://doi.org/10.2307/1251929
- Berger, C., Blauth, R., Boger, D., Bolster, C., Burchill, G., DuMouchel, W., Pouliot, F., Richter, R., Rubinoff, A., Shen, D., Timko, M., & Walden, D. (1993). Kano’s methods for understanding customer-defined quality. Center for Quality of Management Journal, 2(4), 3–36.
- Bhave, A. (2002). Customer satisfaction measurement. Quality & Productivity Journal. Retrieved from http://www.symphonytech.com/articles/pdfs/satisfaction.pdf
- Andaleeb, S. S., Haq, M., & Ahmed, R. I. (2007). Reforming inner-city bus transportation in a developing country: A passenger-driven model. Journal of Public Transportation, 10(1), 1–25. https://doi.org/10.5038/2375-0901.10.1.1
- Rahaman, K. R., & Rahaman, M. A. (2009). Service quality attributes affecting the satisfaction of railway passengers of selective route in southwestern part of Bangladesh. Theoretical and Empirical Researches in Urban Management, 4(3), 115–125.
- Rahman, F., Das, T., Hadiuzzaman, M., & Hossain, S. (2016). Perceived service quality of paratransit in developing countries: A structural equation approach. Transportation Research Part A: Policy and Practice, 93, 23–38. https://doi.org/10.1016/j.tra.2016.08.008
- Islam, M. R., Hadiuzzaman, M., Banik, R., Hasnat, M. M., Musabbir, S. R., & Hossain, S. (2016). Bus service quality prediction and attribute ranking: A neural network approach. Public Transport, 8(2), 295–313.
- Mowrin, A. N., Hadiuzzaman, M., Barua, S., & Rahman, M. M. (2019). Identifying key factors of commuter train service quality: An empirical analysis for Dhaka city. Malaysian Journal of Civil Engineering, 31(2). https://doi.org/10.11113/mjce.v31.16118
- Lai, W.-T., & Chen, C.-F. (2011). Behavioral intentions of public transit passengers—The roles of service quality, perceived value, satisfaction and involvement. Transport Policy, 18(2), 318–325. https://doi.org/10.1016/j.tranpol.2010.09.003
- Hananto, D., & Ali, S. (2020). Effect of service quality and satisfaction level on consumer loyalty of MRT trains: Case study in Ciutat Area. Annual International Conference on Management Research Procedia, 5(1), 370–377. https://doi.org/10.2991/aebmr.k.200331.047
- Rahmat, R. A. O. K., Borhan, M. N., Ismail, A., & Rahmat, R. A. (2018). Factors influencing the perception and satisfaction of public transport passengers in Kuala Lumpur. Transportation Research Part A: Policy and Practice, 118, 1–13.
- Mat, A., Bahry, N. S., Kori, N. L., Asnawi, N. H., Salleh, N. F., Nordin, R., & Saad, M. N. (2018). The influence of public commuters’ satisfaction towards Mass Rapid Transportation (MRT) services among Kuala Lumpur riders: A PLS-ML approach. Transport Policy, 45, 54–67.
- Jaya, N. I. H., Borhan, M. N., Ibrahim, A. N. H., Ismail, A., & Mat Yazid, M. R. (2022). The influence of service quality on user’s perceived satisfaction with light rail transit service in Klang Valley, Malaysia. Mathematics, 10(13), 13–22. https://doi.org/10.3390/math10132213
- Ibrahim, A. N. H., & Borhan, M. N. (2023). Studying the factors influencing user satisfaction and reuse intention towards monorail service using a PLS-ML approach: A case study in Kuala Lumpur, Malaysia. IOP Conference Series: Materials Science and Engineering, 1289(1), 446–454.
- Khan, A. F., & Ivan, P. (2023). Integrating machine learning and deep learning in smart cities for enhanced traffic congestion management: An empirical review. Journal of Urban Development and Management, 2(4), 211–221. https://doi.org/10.56578/judm020404
- Djellali, H., Zine, N. G., & Azizi, N. (2016). Two stages feature selection based on filter ranking methods and SVM-RFE on medical applications. In Modelling and Implementation of Complex Systems: Proceedings of the 4th International Symposium, MISC 2016, Constantine, Algeria (pp. 281–293). Springer.
- Das, A. S. (2024). KoboToolbox. In Open electronic data capture tools for medical and biomedical research and medical allied professionals (pp. 241–329). Academic Press.
- (Although this repeats #31 from above, I keep it unchanged because you listed it twice.)
- Disha, R. A., & Waheed, S. (2022). Performance analysis of machine learning models for intrusion detection system using Gini Impurity-based Weighted Random Forest (GIWRF) feature selection technique. Cybersecurity, 5(1), 1.
- Baldi, P., Brunak, S., Chauvin, Y., Andersen, C. A., & Nielsen, H. (2000). Assessing the accuracy of prediction algorithms for classification: An overview. Bioinformatics, 16(5), 412–424. https://doi.org/10.1093/bioinformatics/16.5.412
- Yacouby, R., & Axman, D. (2020, November). Probabilistic extension of precision, recall, and F1 score for more thorough evaluation of classification models. In Proceedings of the First Workshop on Evaluation and Comparison of NLP Systems (pp. 79–91). https://doi.org/10.18653/v1/2020.eval4nlp-1.9
- Khan, A. F. S. A. R. (2024). Modelling perceived service quality of metro rail of Dhaka City using structural equation approach (Master’s thesis, Bangladesh University of Engineering and Technology).
- Lim, S., Wong, W. C., Wu, Z. X., & Tan, C. S. (2020). The impact of perceived accessibility to MRT service and perceived neighborhood safety on quality of life: A study in Malaysia. Asia-Pacific Social Science Review, 20(4), 10. https://doi.org/10.59588/2350-8329.1338
Conflict of Interest Statement
The authors declare that they have no known financial or personal conflicts of interest that could have influenced the work reported in this manuscript.
Author Contributions
Data Availability Statement
The data supporting the findings of this study are not publicly available but can be obtained from the authors upon reasonable request.
Supplementary Materials
There are no supplementary materials to include.