Volume 24 number 1 article 1312 pages 21-35
Received: Nov 19, 2025 Accepted: Dec 17, 2025 Available Online: Jan 24, 2026 Published: Mar 02, 2026
DOI: 10.5937/jaes0-62872
HYBRID AI-BASED PREDICTIVE QUALITY CONTROL FOR AUTOMOTIVE CUTTING PROCESSES: A SMART MANUFACTURING APPROACH UNDER IATF 16949
Abstract
Ensuring product quality in the automotive industry becomes a technical strategic challenge in the era of digital and networked supply chains. Traditional final inspection methods, often reactive, are not sufficient to attempt the rigorous expectations of IATF 16949. The case of covers seating industry must be at the forefront of industrial excellence. Evoking comfort, functionality, and aesthetics for customer, taking into account that the cutting area in such industry is the focal point to loop considered as internal supplier in the covers supply chain, cutting output is the input for all assembly lines, which means that an uncontrolled quality KPI will disturb the manufacturing process. A hybrid AI –based predictive quality control modeling in cutting process is used combines expert-based validation through the Fuzzy Delphi Method to define the factors affecting the quality of cut products. The integration of data driven prediction (AI and IoT) represented in a linear-regression-based supervised learning model trained and learned with a simulated dataset from real production conditions according to literature review and experts feedback to detect and prevent failures in the early stage of production. The analysis shows the three variates (cutting speed, cutting temperature, vibration intensity) predefined from the literature review were validated as input data. The results indicate a high predictive quality accuracy since the coefficient of determination R2 =0.87 and the model statistically very significant ANOVA results. Concluding that the vibration factor have the most significant impact on quality cutting defect. This hybrid AI-based predictive approach provides an improvement lever of the smart automotive manufacturing chains supporting data driven decisions under the IATF 16949.
Highlights
- A hybrid AI-based predictive model integrates Fuzzy Delphi and data-driven learning to assess cutting quality.
- Three key process factors — cutting speed, temperature, and vibration—were validated as significant quality drivers.
- The model achieved high predictive accuracy with R² = 0.87 and statistically significant ANOVA results.
- Vibration intensity identified as the most influential factor affecting cutting defects in automotive seat cover production.
Keywords
Content
1 Introduction
Recently, the digitalization of the industrial supply chain has evolved to be a pillar in present production systems. Especially the car industry, characterized by an exacting precision, stringent quality criteria and complex supplier networks, is in the front- grade of this change [1; 2]. The growing trend toward flexibility, traceability, and efficiency in production has clearly driven the rise of intelligent technology including AI and IoT [3; 4]. Real-time tracking, data-driven decision-making and adaptive control are realized using these technologies [5]. In the automotive, which is regulated by tight IATF 16949 requirements [6], requires a systematic quality guarantee that goes beyond traditional testing [7; 8]. The digital revolution in the automotive supply chain, has founded a new era of intelligent quality management, where connected systems and machine learning algorithms can improve efficiency, reliability and predictivity throughout the production lifecycle.
Nonetheless, despite these advancements in technology, many industries still using a reactive quality control system, which is confined to end-of-line inspection and detect after production [9]. This reactionary approach results in high nonconformance costs, process inefficiencies and late corrective action. With increased competitiveness and higher customer expectations, it is increasingly recognized that traditional quality assurance (QA) strategies reliant on post manufacturing inspection are not adequate to guarantee performance, traceability, and satisfaction of the customer [10; 11].
This has caused the industry to move towards a predictive and proactive quality paradigm [12]. This new view makes use of real time data acquisition and AI based analytics for predicting a potential defect, adjusting process parameters in “real time” and feedback control to continuously improve the production performance [13; 14]. Artificial intelligence has taken a leap forward in recent years and has become a key area of focus and a strategic lever for quality control in industrial systems, since the architecture of these systems focuses primarily on fault prediction and automated detection of non-conformities, based on real data for a practical decision-making loop [15]. Recently, three typologies of approaches that stand out in the literature review for quality control as detailed in table 1:
Table 1. AI typologyies and their role in industrial quality control
|
AI Typology |
Purpose and definition |
Industrial application example |
Main Benefits |
|
Computer Vision |
Computer Vision is an AI approach used to detect visual defects such as scratches, foreign bodies on the material, deformations, color defects usig image acquisition and processing techniques [16]. This system lead to a reduction in human dependency by relieving production/inspection operators while remaining vigilant in terms of product conformity. |
1/Surface inspection in the paint shop – BMW [17] |
1/Detection of 40-50 μm defects; zero defects. |
|
Machine Learning |
Machine learning is a data-driven modelling approach used in particular to collect data from industrial sensors with the aim of predicting the probability of an event occurring. We use random forests or support vector system (SVMs) as examples of this type of system. This technology is proactive rather than reactive model for implementing predictive action plans. [19] |
Audio signal detection - BMW Dingolfing: Acoustic inspection at the end of the line [18]. |
Reliable acoustic quality control. |
|
Deep Learning |
Deep learning is a strategy use convolutional neural networks (CNN) capable of learning complex nonlinear patterns. This methodology of approach recommended in complex cases, for non-accessible faults, which are not directly visible [20]. |
In-line tomography of electric motors – BMW [21]. |
Automatic internal fault detection |
Accordingly, predictive quality models-based process control is a natural and necessary transition towards the vision of zero-defect production and sustainable competitive levels. The process quality is modeled using a mathematical or algorithmic representation, incorporating factors influencing quality as a result, expressed through the number of defects, rework and scrap, while taking into account the impact of production parameters. Well-defined and effective integration of these models into supply chains makes them more intelligent, with a strategic vision. The new approach towards intelligent supply chains is designed to analyze data collected in real time on production lines, and the combination of AI-IoT will be an industrial breakthrough [22]. On the other hand, when reviewing from one article to another, it became clear that there is fewer researches; that integrates this concept for alignment and compliance with the required standards and the logic of IATF 16949.
Although Manufacturing 4.0 is already well underway, quality management systems are among the last to get automated, and they remain one of the least predictive aspects of industrial operations. The majority of industries continue to rely on manual or semi-automated inspection, such techniques are reactive by nature and do not stop there until defects have been created. This reaction is resulting in delays, inefficient use of resources and high non-conformance costs, especially in a high accuracy industry such as automotive manufacturing.
Despite of the IATF 16949 being a strong reference process control and continuous improvement framework, it does not direct into how digital and intelligent technologies should be employed to reach predictive quality assurance. In this context, the main motivations of this work are:
- Change being like reactive inspection-based QA systems into predictive (data driven) decision-making systems that can identify quality deviation before it happens.
- Incorporating AI and IoT innovations into a connected, IATF 16949-based quality model to improve visibility, assurance and performance.
- Construct and verify a predication model, as a case of real usages cutting automotive seat covers to determine which parameters of process effect defects occurrence.
- Prove how AI-based predictive can contribute to zero-defect manufacturing, and to process improvement in the automotive industry.
In view of these challenges as well as the gaps identified, this study seeks to make a contribution towards an intelligent IATF 16949-compliant supply chain model, taking the case of an automotive accessory production line for car covers [23] in the cutting process. Developing an intelligent supply chain model that benefits from literature review, the knowledge of experts integrating Fuzzy Delphi approach [24] to choose the variates affecting number of defects in cutting area. In addition, the use of AI-based predictive quality control in order to achieve the reduction of time and waste inspection, increase customers’ satisfaction and has full compliance with IATF 16949. The model combines simulation data and linear regression analysis in the identification of key process variables affecting defect generation [25]. Through detecting reasons of non-conformity and predicting, the introduced methodology exhibits how AI supervised learning can convert traditional quality management from reactive into a predictive, proactive, self-optimizing one. In such a way, the study aims to serve theoretical development as well as practical needs for application of a framework that can be customized and used on the shop floor in industry practice.
In the end, this research illustrates how the combination of Fuzzy Delphi method, AI, IoT and IATF 16949 principles can change the future landscape of automotive quality management.
2 Materials and methods
As the automotive industry continues to grow, it faces increasing challenges and has become more demanding in terms of compliance with ISO 9001 and IATF 16949 standards [26]. Therefore, in a tough competitive industrial context, the primary measure of the performance for intelligent supply chains is the quality indicator [27], while in this notorious digital transformation, the integration of artificial intelligence (AI) and internet of things (IoT), also advanced mathematical models make it possible to anticipate defects and reinforce quality control. This article proposes a predictive simulation model integrating AI-based and IoT to improve the detection of non-conformities in a high-performance supply chain.
2.1 Description of the industrial process studied
The process targeted in our article, is the cutting process; an essential phase in the design and accessory automotive industry; more specifically, the industry of automotive seat covers. In order to have a clear vision of such industry process, the figure 2 illustrates the overall process flow of automotive cover manufacturing, from raw material reception to final delivery. The process begins with the reception of incoming materials, followed by unloading and initial storage under controlled conditions to ensure material traceability and compliance with quality standards. Subsequently, material flows are managed and directed toward cutting operations. For the cutting phase, as a crucial sub-operation in the manufacture of the cover product, the materials are cut in the form of raw material rolls on specific automated machines (CNC) [28]. Then comes the inspection phase of the cut pieces, checking the dimensional accuracy of the piece, the irregularity of the cut, the conformity of the internal shapes in the cut piece...etc [16]. The precision of the cut depends on the parameters and conditions of the CNC machine, which has a direct impact on the final quality of the cover. The validated cut components are transferred to the cover assembly lines, where individual elements are assembled before proceeding to final cover assembly. At this stage, an additional quality control and packaging process is performed to ensure conformity with dimensional, aesthetic, and functional requirements. Finally, the finished covers are managed through pool stock logistics, enabling optimized inventory control and synchronized deliveries to downstream assembly plants. This structured process flow supports early defect detection and provides a suitable framework for implementing predictive quality control under IATF 16949 requirements. The global covers manufacturing process is presented in figure 2 [29].
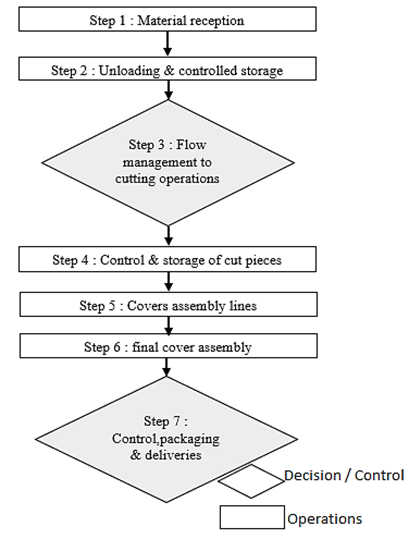
Fig. 1. Process functional decomposition of a cover
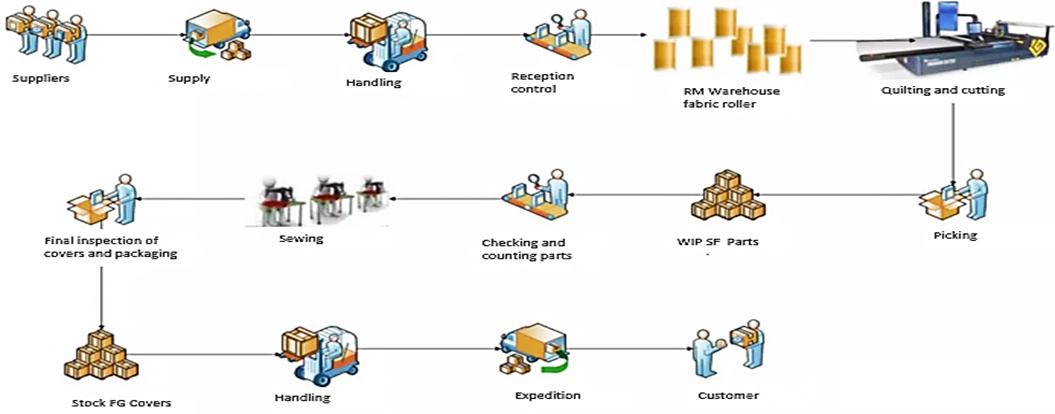
Fig. 2. Covers manufacturing process [29]
2.2 Intelligent production environment simulation: Fuzzy Delphi Method choosing studied parameters
In the absence of real data from an industrial environment, a simulated dataset created to represent an intelligent production line, equipped with IoT sensors. These sensors enable continuous measurement of critical variables that can influence product quality the target variable is the number of defects detected on the cut parts inspected at the end of the line.
The three variables selected as critical factors according to the literature review are:
- Cutting speed (in m×min-1): direct impact on cutting accuracy.
- Machine temperature (in °C): affects material dilatation and precision.
- Vibration level (in mm×s-1): cause of major defects in cutting.
These parameters are well known in the literature, and for a good basis for study, we will use the Fuzzy Delphi approach, a decision-making method for validating or confirming selected parameters. This is the role of the classic Delphi method, coupled with fuzzy logic to eliminate the subjectivity of judgment and human uncertainty from the Delphi approach.
This method begins with the selection of parameters as already mentioned and reviewed in the literature in the fields of cutting, the textile and clothing industry, CNC machine operation, and its role. Next, a Likert scale questionnaire will be given to a sample of 10 experts who will be selected using Delphi methods. A minimum of 10 experts with at least 5 years of expertise and a higher academic level will be required as criteria for selecting the panel of experts, which will then allow us to collect the experts' judgments in a more objective and qualitative manner. We will transform the qualitative judgments into quantitative data using the fuzzy Likert scale as shown in the table 2 below [30], by assigning a fuzzy value in the form of a triangular fuzzy number (TFN) (l, m, u) for each modality [31; 32]. The TFN is presented in figure 3, this set range from 0 to 1, where:
- l: least value, the minimum assessment value
- m: most probable value
- u: upper (greatest) value, the maximum assessment value.
Fig. 3. Triangular fuzzy number
Table 2. Seven points of fuzzy scale
|
Qualitative terms |
Acronym |
Crisp Scale |
Fuzzy Values |
|
Very weakly important |
VWI |
1 |
(0.0,0.0,0.1) |
|
Weakly important |
WI |
2 |
(0.0,0.1,0.3) |
|
Low important |
LI |
3 |
(0.1,0.3,0.5) |
|
Moderately important |
MI |
4 |
(0.3,0.5,0.7) |
|
High important |
HI |
5 |
(0.5,0.7,0.9) |
|
Very high important |
VHI |
6 |
(0.7,0.9,1.0) |
|
Extremely important |
EI |
7 |
(0.9,1.0,1.0) |
The following step after collecting expert opinions is to aggregate fuzzy opinions known as the Fuzzy Geometric Mean Value by applying the following formula, where n is the number of experts and i the factor studied:
| $\bar{A}_j = \left( \frac{1}{n}\sum_{i=1}^{n} L_i,\; \frac{1}{n}\sum_{i=1}^{n} m_i,\; \frac{1}{n}\sum_{i=1}^{n} u_i \right)$ | (1) |
Continuing our approach with the defuzzification step, we convert fuzzy values into precise numbers known as crisp value $C_j$, which are the overall fuzzy scores for each factor, which can be expressed through:
| $C_j = \frac{l + m + u}{3}$ | (2) |
As a final step, the acceptance threshold for the parameter to be retained must be greater than or equal to the threshold value of 0.5 named cutoff value α; otherwise, it is eliminated, this cutoff threshold value is commonly used in Fuzzy Delphi studies to ensure consensus and relevance among experts [33].
- If $C_j$≥ 0.5, the factor is accepted.
- If $C_j$< 0.5, the factor is rejected.
2.3 Model framework
The model used in this study is a multiple linear regression [34] as a method for supervised learning, qualified as a transparent and interpretable predictive model, which will models the relationship between process variables (input) and the number of defects (output).
The model is expressed as follows:
| $\text{Defects} = \beta_0 + \beta_1 \cdot \text{Cut speed} + \beta_2 \cdot \text{Temperature} + \beta_3 \cdot \text{Vibration} + \varepsilon$ | (3) |
Where:
- β0: constant (interception)
- β1, β2, β3: coefficients of variables, representing their impact on defects
- ϵ: epsilon is the error term.
For the data simulation part that comes just after the validation of parameters and model definition, real production conditions were used to create a database of 50 observations. Each valid parameter is associated with a well-defined range based on industry standards, literature review, and feedback from the panel of pre-selected experts, as well as adding the accordance to intelligence expertise from machine operators; we arrived also at the realistic coefficients for each parameter.
To enhance realism, we add a random noise to our model to obtain output data on the number of defects. This noise will represent sensor inaccuracies, micro-variations in machines, and environmental disturbances.
In brief, the developed approach combines expert-based validation and data-driven prediction to set up a hybrid AI-based predictive quality control model. Deep learning methods can be highly accurate but require large datasets and computing power; our approach is simpler and interpretable, suitable for smaller datasets. Taking into account the limitations in data availability represent one of the most significant challenges identified throughout this study.
The FDM was employed as the first phase for determination and validation of critical process parameters influencing the cutting quality. A panel of experts assessed the relevance and importance of each factor. Using linguistic scales converted in to fuzzy number values. After several consensus and defuzzifications, three key factors were determined: cutting speed, cutting temperature and vibration intensity. In the second stage, a linear-regression-based supervised learning model is trained with the validated preference set obtained at first stage as input feature vector for the quality indicators (number of defects) and predicted output values. Quality outcomes are predicted using machine-learning model learned on simulated data, ensuring that this model is interpreted and meets the requirements of IATF 16949 in an industrial world that relies on AI-based solutions.
The architecture of our system is based on the concept of intelligence, with the aim of creating an intelligent supply chain through anticipation and early detection. Figure 4 below presents the model architecture.
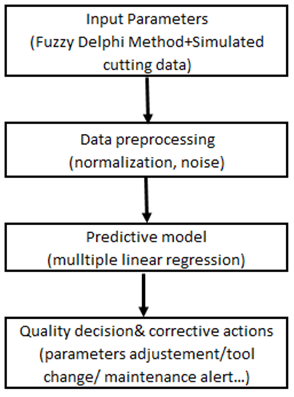
Fig. 4. Architecture model
3 Results and discussion
3.1 Modeling and simulation results
3.1.1 Building the production line simulation model: Fuzzy Delphi Method to choose factors
In this section, we focused on a production line in the cutting area for the manufacture of car seat covers. To carry out this study and achieve our objective, we first need to validate the study parameters that affect the quality of the cut product. To do this, we will use the fuzzy Delphi method. Applying the FDM method, we selected 10 experts to evaluate the predefined factors: speed, temperature, and vibration, in a literature-based approach. The table 3 below details our panel of selected experts, the expert panel was selected based on different criteria, including professional position, years of experience in the automotive industry more than 4 years, direct involvement in cutting or quality control processes, and familiarity with IATF 16949 requirements.
Table 3. Expert list for decision
|
Expert |
Position |
Area of expertise |
Industry Experience (years) |
Selection criteria |
|
|
Expert 1 |
Plant Operations manager |
Production operations, process coordination |
18 |
Extensive experience in plant-level operations and decision-making related to cutting and assembly processes |
|
|
Expert 2 |
Quality coordinator |
Quality systems, IATF 16949 compliance |
6 |
Direct responsibility for quality monitoring, audits, and non-conformity management |
|
|
Expert 3 |
Process engineer |
Cutting process engineering and optimization |
9 |
Hands-on experience in defining cutting parameters and improving process stability |
|
|
Expert 4 |
Quality Manufacturing engineer |
Manufacturing quality engineering |
6 |
Involvement in defect analysis, root cause analysis, and continuous improvement |
|
|
Expert 5 |
Customer contact engineer |
Customer requirements and quality feedback |
7 |
Interface between customer expectations and internal quality performance |
|
|
Expert 6 |
Production manager |
Production planning and execution |
10 |
Operational expertise in managing production flow and defect prevention |
|
|
Expert 7 |
Plant Quality manager |
Plant-level quality strategy |
12 |
Oversight of quality performance and implementation of IATF 16949 standards |
|
|
Expert 8 |
Supply chain manager |
Logistics and material flow management |
8 |
Expertise in material traceability, supplier coordination, and inventory control |
|
|
Expert 9 |
Technical manager |
Technical systems and industrial equipment |
10 |
Experience in machinery performance, maintenance coordination, and technical problem-solving |
|
|
Expert 10 |
Supplier quality assurance engineer |
Supplier quality management |
5 |
Expertise in supplier audits, incoming material quality, and defect prevention at source |
Subsequently, a Likert scale questionnaire is assigned to each expert for a qualitative assessment of each parameter. After collecting the responses from our collaborators in this study, the Fuzzy scale table is used to convert the data and produce quantitative values in the form of triangular numbers. Table 4 below summarizes the qualitative results of the experts' assessments, and Table 5 shows the conversion into fuzzy values.
Table 4. The expert’s qualitative assessment
|
Factor |
Expert 1 |
Expert 2 |
Expert 3 |
Expert 4 |
Expert 5 |
|
Cutting Speed |
EI |
EI |
HI |
EI |
VHI |
|
Temperature |
HI |
MI |
VHI |
VHI |
EI |
|
Vibration |
VHI |
EI |
MI |
HI |
HI |
|
Factor |
Expert 6 |
Expert 7 |
Expert 8 |
Expert 9 |
Expert 10 |
|
Cutting Speed |
HI |
VHI |
MI |
HI |
HI |
|
Temperature |
VHI |
HI |
HI |
HI |
MI |
|
Vibration |
VHI |
VHI |
VHI |
EI |
HI |
Table 5. Defuzzification results
|
Factor |
Expert 1 |
Expert 2 |
Expert 3 |
Expert 4 |
Expert 5 |
|
Cutting speed |
(0.9,1.0,1.0) |
(0.9,1.0,1.0) |
(0.5,0.7,0.9) |
(0.9,1.0,1.0) |
(0.7,0.9,1.0) |
|
Temperature |
(0.5,0.7,0.9) |
(0.3,0.5,0.7) |
(0.7,0.9,1.0) |
(0.7,0.9,1.0) |
(0.9,1.0,1.0) |
|
Vibration |
(0.7,0.9,1.0) |
(0.9,1.0,1.0) |
(0.3,0.5,0.7) |
(0.5,0.7,0.9) |
(0.5,0.7,0.9) |
|
Factor |
Expert 6 |
Expert 7 |
Expert 8 |
Expert 9 |
Expert 10 |
|
Cutting speed |
(0.5,0.7,0.9) |
(0.7,0.9,1.0) |
(0.3,0.5,0.7) |
(0.5,0.7,0.9) |
(0.5,0.7,0.9) |
|
Temperature |
(0.7,0.9,1.0) |
(0.5,0.7,0.9) |
(0.5,0.7,0.9) |
(0.5,0.7,0.9) |
(0.3,0.5,0.7) |
|
Vibration |
(0.7,0.9,1.0) |
(0.7,0.9,1.0) |
(0.7,0.9,1.0) |
(0.9,1.0,1.0) |
(0.5,0.7,0.9) |
After completing the defuzzification process, we will now proceed to calculate the parameters associated with the analysis: the fuzzy geometric mean value (FGMV) and the fuzzy score as a crisp value (C). Table 6 below shows the results of the fuzzy Delphi analysis. According to the results obtained in this table, all defuzzification values for the analyzed factor exceed the cutoff value α, which means that the fuzzy score (C) >= 0.5. These results prove that all measured elements are accepted. As such, industry experts confirm our preselected parameters.
Table 6. Fuzzy Delphi analysis result
|
Factor |
FGMV |
Fuzzy Score (C) |
Threshold cutoff value |
Expert Agreement |
|
Cutting speed |
0.64, 0.81, 0.93 |
0.793 |
0.5 |
Accept |
|
Temperature |
0.56, 0.75, 0.9 |
0.737 |
0.5 |
Accept |
|
Vibration |
0.64, 0.82, 0.94 |
0.8 |
0.5 |
Accept |
By validating the input parameters that affect the quality of the cut product, which visualized in terms of the number of defects detected in the final inspection of each production line in the cutting area, we can define the value ranges for each parameter at this stage, with the help of industry experts familiar with the cutting process. Using interviews, which provided us with plausible ranges, as well as relevant basic tools such as CNC machine manuals [35] and studies on CNC cutting, textiles, and clothing those focusing on the production of automotive seat covers [16]. Table 7 below summarizes the realistic ranges identified for the remainder of our study on the cutting process.
Table 7. Plausible ranges of variables in the cutting process
|
Variable |
Type |
Realistic range |
Unit |
Justification |
|
Cutting speed |
Input |
45 – 55 |
m×min-1 |
In line with industrial CNC machines for automotive fabrics [36] and experts |
|
Temperature |
Input |
65 – 75 |
°C |
Based on experts, engine temperature and CNC cutting machines [37] |
|
Vibration |
Input |
1.5 – 2.5 |
mm×s-1 |
According to experts. |
1.1.2 Identification of expected relationships between inputs and outputs
In this case, we consider that the defects are linearly dependent. The regression model is expressed as follows:
| $\text{Defects} = \beta_0 + \beta_1 \cdot \text{Cut speed} + \beta_2 \cdot \text{Temperature} + \beta_3 \cdot \text{Vibration} + \varepsilon$ | (4) |
Where:
- β0: constant (interception)
- β1, β2, β3: coefficients of variables, representing their impact on defects
- ϵ: is the error term.
Based on the literature and industrial feedback from our panel of experts and according to intelligence expertise from machine operators, we arrived at the realistic coefficients as detailed in Table 8. In order to make the simulated dataset more realistic and representative of an industrial environment, a random noise component added to the generated data. This noise simulates the natural variability observed in real production systems, which can arise from sensor imprecision, material heterogeneity, or environmental fluctuations. The amplitude of this noise was set to ±0.5, corresponding approximately to 5% of the total range of the target variable (number of defects). This level of variability is consistent with industrial processes that are relatively stable but still subject to small random disturbances.
Table 8. Regression model coefficient
|
Coefficient |
Value |
Description |
|
β0 |
5 |
Basic defects, even if everything is optimal |
|
β1 |
0.1 |
Low-speed influence |
|
β2 |
0.3 |
Moderate temperature influence |
|
ϵ |
±0.5 |
Noise, random value to simulate industrial variability |
As a result, the equation (5) is a linear formula used to represent the relationship between sensors and defects:
| $\text{Defects} = 5 + 0.1 \cdot \text{Cut speed} + 0.3 \cdot \text{Temperature} + 1.5 \cdot \text{Vibration} + \text{noise}$ | (5) |
The brief is to determine the number of defects occurring well in advance of the end-of-cutting phase, using the three sensors selected for data collection: cutting speed (in m×min-1), machine temperature (in °C) and cutting vibration (in mm×s-1).
A data simulation is realistically generated as a set of 50 observations, since real data are not available, under the assumption that temperature and vibration are two criteria influencing the number of defects. Whereas to be more realistic, it is necessary to add noise as demonstrated in our article in the previous section, a feature encountered in the industrial world at the time of production. So as to model these relationships, we have opted for multiple linear regression modelling following equation (5).
The table 9 below is a sample of 10 observations shows the simulation generated to train the model, the whole 50 observations detailed in Appendix. The simulation developed from plausible ranges of variables in the cutting process and the linear formula predefined. As output the number of defects and the influencing characteristics: temperature, speed and vibration taking into account the noise in the calculation on the formula.
Table 9. Simulated dataset - 10 observations
|
Observation |
Speed (m×min-1) |
Temperature (°C) |
Vibration (mm×s-1) |
Defects |
|
1 |
51 |
70 |
1,6 |
33,49 |
|
2 |
48 |
68 |
1,87 |
32,91 |
|
3 |
52 |
71 |
2,17 |
34,64 |
|
4 |
49 |
69 |
2,17 |
33,49 |
|
5 |
51 |
71 |
2,09 |
34,57 |
|
6 |
54 |
69 |
1,77 |
33,87 |
|
7 |
47 |
69 |
2,06 |
33,69 |
|
8 |
51 |
71 |
1,88 |
34,56 |
|
9 |
52 |
72 |
2,47 |
35,26 |
|
10 |
49 |
69 |
2,35 |
33,87 |
After generating the above dataset, the relationship between defects and sensors is then automatically learned by a linear regression model as a supervised learning, which finds the most relevant coefficients from the data. After training, the model delivers the following results detailed in the table 10.
The regression results show a very good predictive accuracy, since the coefficient of determination R2 =0.87. The impact of each variable as shown differs from one variable to another; the variable that comes first in terms of influence on the number of defects, with a coefficient of 1.50, is vibration, followed by temperature, with a coefficient of 0.31. While the results show, that speed has a weaker impact on the number of defects increase (0.095). Which means an increase in the vibration that exhibits the highest regression coefficient parameter; leads to higher defect probability. Moreover, Regarding the analysis of variance ANOVA F=109.21 very high value demonstrates and confirms that the predictive model is excellent, and the p-value is well below the threshold of 0.05 with a value of 6.162*10-21, validating that the model is statistically very significant. Automatically we reject the null hypothesis, although the variables in our study (speed, temperature, vibration) have a significant explanatory relationship on the number of defects. From these results, the initial intuition that the vibration variable plays a critical and crucial role in cutting quality as the primary contributor to defect occurrence is confirmed.
Table 10. Regression statistics report
|
Regression statistics |
||||||
|
Coefficient of multiple determination |
0,93642455 |
|||||
|
Coefficient of determination R2 |
0,87689093 |
|||||
|
Coefficient of determination R2 |
0,86886208 |
|||||
|
Standard error |
0,29808179 |
|||||
|
Observations |
50 |
|||||
|
Variance Analysis ANOVA |
||||||
|
|
Degree of freedom |
Sum of squares |
Average square |
F |
Critical value of F |
|
|
Regression |
3 |
29,1128193 |
9,70427309 |
109,21747 |
6,16E-21 |
|
|
Residuals |
46 |
4,08722672 |
0,08885275 |
|||
|
Total |
49 |
33,200046 |
|
|||
|
|
Coefficients |
Standard error |
Statistics t |
Probability |
Lower limit for confidence level = 95% |
Upper limit for confidence level = 95% |
|
Constant |
4,59633248 |
2,09904211 |
2,18972858 |
0,03365345 |
0,37117986 |
8,8214851 |
|
Cutting Speed |
0,09561634 |
0,0162588 |
5,88089616 |
4,37E-07 |
0,06288906 |
0,12834362 |
|
Temperature |
0,30979236 |
0,03074701 |
10,075529 |
3,20E-13 |
0,24790185 |
0,37168288 |
|
Vibration |
1,50393887 |
0,16643361 |
9,03626908 |
9,22E-12 |
1,16892539 |
1,83895235 |
Figure 5 showing the distribution of residuals versus predicted values, illustrating the fit of the regression model. Which means that the predicted defect rates closely match the observed values, with residuals ranging mostly between -0.5 and +0.5. This indicates a stable and unbiased model performance. No significant trend detected in the residual distribution, confirming the adequacy of the regression model for predictive quality estimation. These results show that the integration of the AI system, even in a simulated context, makes it possible to be proactive in predicting defects before production, and to move on to the final visual inspection stage. This system can be defined as a strategic industrial lever for quality improvement, meeting IATF 16949 standards.

Fig. 5. Residual graph
Figure 5 showing the distribution of residuals versus predicted values, illustrating the fit of the regression model. Which means that the predicted defect rates closely match the observed values, with residuals ranging mostly between -0.5 and +0.5. This indicates a stable and unbiased model performance. No significant trend detected in the residual distribution, confirming the adequacy of the regression model for predictive quality estimation. These results show that the integration of the AI system, even in a simulated context, makes it possible to be proactive in predicting defects before production, and to move on to the final visual inspection stage. This system can be defined as a strategic industrial lever for quality improvement, meeting IATF 16949 standards.
3.1.2 Integrated AI-Based architecture for predictive monitoring and decision making in cutting operation
The proposed architecture aims to predict the quality deviations occurring during the automated cutting process of automotive fabrics and synthetic materials. As illustrated in Figure 6, the system architecture is composed of four main layers: data acquisition, preprocessing, prediction, and decision support.
In the data acquisition layer, IoT-based sensors mounted on the automated cutting station continuously measure process parameters such as cutting speed, tool vibration, and cutting temperature. These parameters are known to have a direct influence on the cut quality and material integrity. Since real industrial data were confidential and partially unavailable, a synthetic dataset was simulated to replicate realistic production variability. A Gaussian noise of ±0.5 was added to each variable to represent natural measurement uncertainty and equipment fluctuations.
The preprocessing layer performs normalization and outlier filtering to ensure model stability. Data are synchronized and converted into time-series form, allowing statistical correlation between parameters and cut quality indicators.
In the prediction layer, a multiple linear regression model was trained using regression analysis tool to estimate the Quality KPI (number of defects) as a function of vibration amplitude, cutting speed, and temperature. The regression analysis yielded a determination coefficient R2=0.87, showing a strong predictive relationship. The ANOVA test confirmed the statistical significance of the model with p<0.001.Finally, the decision and feedback layer compares predicted and actual defect rates. When a deviation beyond the tolerance threshold is detected, the system can recommend real-time adjustments such as reducing cutting speed, adjusting tool temperature, or triggering blade maintenance, taking into account that vibration parameter is the primary contributor of defects occurrence in cutting area. This predictive control approach supports IATF 16949 requirements by enabling proactive quality management and minimizing scrap in the automotive supply chain.
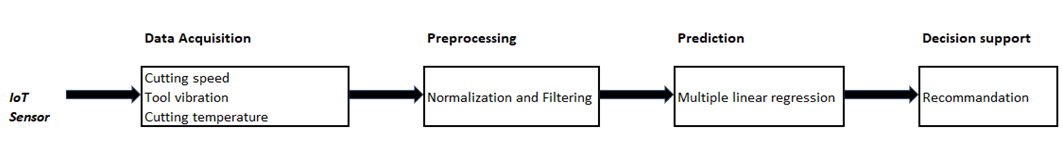
Fig. 6. AI-Based predictive model architecture for the automated cutting process in automotive manufacturing
For the integration of AI in the decision aid, we have built two simulation scenarios as detailed in table 11:
Table 11. Simulation scenarios
|
Scenario A: without AI/IoT combination |
Scenario B : with AI/IoT combination |
|
Production operates in the traditional way, where quality defects are only visualized after final inspection of the cut product, no real-time processing of sensor data. |
The predictive model receives sensor data for each cycle and anticipates the number of expected faults. This information is used to trigger preventive actions, to go beyond the corrective mode and optimize operation; if the threshold is exceeded, actions can be triggered (slow down the line, check the machine, etc.). |
3.2 Discussion
Following the development of Hybrid AI-based predictive quality model, the results show promising value in migrating conventional quality management behavior from automotive supply chains towards intelligent systems. The results suggest that the combination of linear regression as a supervised machine learning method in our case study and IoT-based data acquisition can lead to an enhanced understanding of how the process variables are related to defect creation. More notably, validation of the factors affecting product quality and conformity using Fuzzy Delphi Method demonstrates that data-driven analytics is capable to anticipate imperfections before they happen.
A sensitivity analysis was conducted to evaluate the relative influence of key cutting parameters, namely temperature, vibration, and cutting speed, on product quality. The analysis is based on the magnitude and sign of the regression coefficients obtained from the predictive model. The results indicate that vibration is the most influential parameter affecting defect occurrence. Small variations in vibration levels lead to significant changes in the predicted defect probability, which can be explained by its direct relationship with tool wear, machine instability, and surface irregularities during cutting operations. Temperature parameter shows a moderate influence on quality performance. Elevated temperatures tend to accelerate material deformation and tool degradation, indirectly increasing defect rates, although its impact remains less pronounced than that of vibration, cutting speed exhibits the lowest sensitivity among the analyzed parameters. While extreme speed values may affect surface quality and dimensional accuracy, its influence within the operational range considered in this study is comparatively limited.
These findings highlight the importance of prioritizing vibration monitoring and control in predictive quality strategies. From an industrial perspective, this allows maintenance and process optimization efforts to focus on the most critical parameter, thereby improving efficiency and compliance with IATF 16949 requirements.
Therefore, this result demonstrates the advantage of predictive quality control in accordance with the one of a risk-based thinking and continuous improvement philosophy as defined by IATF 16949. Unlike traditional inspection systems which only identify issues after products are made, predictive-based as opposed to the traditional static and reactive control, it enables the real-time monitoring, adaptive control, dynamic decision which results in minimizing wastage rework and high quality overall improves process efficiency. From an industrial perspective, this development is a significant milestone towards smart manufacturing and zero-defect.
However, predictive quality control comes with its own set of challenges. The limitations in data availability represent one of the most significant challenges identified throughout this study. In many industrial settings, data collection systems are fractured or not very well standardized and that is one of the reasons you can’t build strong AI-based models. Consultants specializing in AI, data and analytics say model interpretability is still a deal breaker for quality managers who have to make certain automated decisions meet IATF 16949 standards and are traceable during audits and certification processes.
Another major finding concerns the human and organizational dimension of digital disruption. The efficacy of predictive quality systems is not only judged in terms of the accuracy of the algorithm, but also on workforce readiness to accept and trust AI recommendation. Accordingly, an attitudinal change towards data driven decision-making and collaborative human–machine interaction is necessary for reaping the benefits of intelligent quality management.
These findings provide insights when comparing them with literature from the field, as most research has been focusing on preventive maintenance or process optimization and just a few studies have discussed smart- based predictive quality models integrated in the IATF 16949 infrastructure. The present study helps to fill this methodological gap and suggests an organized model that integrates elements from standardized quality management with cutting-edge data analysis.
Finally yet importantly,the main limitation of this study lies in the use of simulated data and a limited sample size. So, it provides room for further study. Enrichment of the current model with deep learning, IoT data flow in real-time and digital twins simulations could contribute to an increase in predictive accuracy and decision support. Moreover, transfer of this framework to other manufacturing steps (like assembly, painting or final inspection) could confirm its industrial relevance and scalability.
4 Conclusions
This study presents an innovative framework designed for integration within the automotive manufacturing sector, specifically targeting the cutting stage of seat cover production. The proposed approach combines modeling, simulation, and based artificial intelligence (AI) with the Internet of Things (IoT) to create a predictive system capable of identifying potential defects before they occur. By developing a linear regression model fed with both simulated and real-world datasets, the system enables the anticipation of anomalies that could compromise product quality.
The study focused on three critical parameters; temperature, vibration, and cutting speed; selected from literature and validated through the Fuzzy Delphi Method with expert input. These parameters were monitored using simulated dataset from real environment to ensure the acquisition of reliable and representative data. The integration of this data into the predictive model demonstrated that early detection of irregularities is possible, particularly in fabric cutting operations, thereby reducing the occurrence of defective parts and waste generation.
In addition, this approach is compliant with the IATF 16949 quality management standard, which enables continuous improvement and data driven decisions. It increases the ability to respond on corrective and preventive actions as well as control process variations, contributing to more efficient operation and cost saving due to non-quality.
Finally, these findings show that the automotive industry can embark in industrial revolution through integrating predictive models within decision-making operations. This dance of AI and IoT technologies enables the creation of a smart and robust supply chain, one that can transform raw production data into actionable information converting knowledge into business advantage to improve performance, reliability and competitive edge.
Acknowledgements
The authors would like to thank the automotive experts and collaborators whose valuable contributions and insights were essential to this study, providing validation of parameters study, industrial feedback and access to contextual production constraints. No external funding was received.
References
- Mourtzis, D. (2024). Industry 4.0 and smart manufacturing. In Manufacturing from Industry 4.0 to Industry 5.0 (pp. 13-61). Elsevier. https://doi.org/10.1016/B978-0-443-13924-6.00002-8
- Bigliardi, B., Filippelli, S., Petroni, A., & Tagliente, L. (2022). The digitalization of supply chain: A review. Procedia Computer Science, 200, 1806–1815. https://doi.org/10.1016/j.procs.2022.01.381
- Ghosh, R. K., Banerjee, A., Aich, P., Basu, D., & Ghosh, U. (2022). Intelligent IoT for automotive industry 4.0: Challenges, opportunities, and future trends. In U. Ghosh, D. G. Kamble, & P. K. Sharma (Eds.), Intelligent internet of things for healthcare and industry (pp. 327–352). Springer. https://doi.org/10.1007/978-3-030-81473-1_16
- Varriale, V., Cammarano, A., Michelino, F., & Caputo, M. (2025). Critical analysis of the impact of artificial intelligence integration with cutting-edge technologies for production systems. Journal of Intelligent Manufacturing, 36, 61–93. https://doi.org/10.1007/s10845-023-02244-8
- Kamran, S. S., Haleem, A., Bahl, S., Javaid, M., Prakash, C., & Budhhi, D. (2022). Artificial intelligence and advanced materials in automotive industry: Potential applications and perspectives. Materials Today: Proceedings, 62, 4207–4214. https://doi.org/10.1016/j.matpr.2022.04.727
- Gruszka, J., & Misztal, A. (2017). The new IATF 16949:2016 standard in the automotive supply chain. Research in Logistics and Production, 7(4), 323–332. https://doi.org/10.21008/j.2083-4950.2017.7.4.3
- El Affaki, M., Benhadou, M., Haddout, A. (2025). Operational excellence supported by lean management tools, IATF 16949 automotive standard, and Industry 4.0 pillars: Evidence from automotive companies in Morocco. Engineering, Technology & Applied Science Research, 15(3), 22718–22724. https://doi.org/10.48084/etasr.10600
- Laskurain-Iturbe, I., Arana-Landín, G., Heras-Saizarbitoria, I., & Boiral, O. (2021). How does IATF 16949 add value to ISO 9001? An empirical study. Total Quality Management & Business Excellence, 32(11–12), 1341–1358. https://doi.org/10.1080/14783363.2020.1717332
- Teplická, K., Khouri, S., Mudarri, T., & Freňáková, M. (2023). Improving the quality of automotive components through the effective management of complaints in industry 4.0. Applied Sciences, 13(14), 8402. https://doi.org/10.3390/app13148402
- Silva, A. C., Machado, J., Sampaio, P. (2024). Predictive quality model for customer defects. The TQM Journal, 36(9), 155–174. https://doi.org/10.1108/TQM-09-2023-0302
- Sader, S. (2020). An experimental approach to total quality management in the context of Industry 4.0 (Ph.D. dissertation). Szent István University, Hungary.
- Unver, B., Kabak, Ö., Topcu, Y. I., Altinisik, A., & Cavusoglu, O. (2020). A decision support system for proactive failure prevention: A case in a leading automotive company. Journal of Enterprise Information Management, 33(5), 845–880. https://doi.org/10.1108/JEIM-09-2019-0264
- Kusiak, A. (2023). Smart manufacturing. In S. Y. Nof (Ed.), Springer handbook of automation. Springer, Cham. https://doi.org/10.1007/978-3-030-96729-1_45
- Tao, F., Qi, Q., Liu, A., & Kusiak, A. (2018). Data-driven smart manufacturing. Journal of Manufacturing Systems, 48, 157–169. https://doi.org/10.1016/j.jmsy.2018.01.006
- Djordjevic, A., Pantić, M., Petrovic Savic, S., Dzunic, D., Erić, M., & Stefanovic, M. (2024). Real-time nonconformity management in SMEs within the Internet of Things and Industry 4.0 concepts. International Journal of Strategic Organizational Learning. https://doi.org/10.56830/IJSOL06202404
- Yahyaoui, S., Bilad, A., Zaim, M., & Zaim, F. (2025). Artificial intelligence towards a smart automotive supply chain performance KPIs aligned with IATF 16949 standards. Uncertain Supply Chain Management, 14(4), 213–226. https://doi.org/10.5267/j.uscm.2025.4.001
- BMW Group. (2024). Automated surface processing: Another step towards the BMW iFACTORY at Regensburg paint shop [Press release]. https://www.press.bmwgroup.com/
- Holt, N. (2025, May 20). BMW develops next-level digital manufacturing at Landshut and Regensburg plants. Automotive Manufacturing Solutions. https://www.automotivemanufacturingsolutions.com/
- Mahesh, B. (2020). Machine learning algorithms—a review. International Journal of Science and Research, 9(1), 381–386. https://doi.org/10.21275/ART20203995
- Taye, M. M. (2023). Understanding of machine learning with deep learning: Architectures, workflow, applications and future directions. Computers, 12(5), 91. https://doi.org/10.3390/computers12050091
- Mayorga-González, R., Rivera-Torrente, M., Nikolopoulos, N., Bossers, K. W., Valadian, R., Yus, J., Seoane, B., Weckhuysen, B. M., & Meirer, F. (2021). Visualizing defects and pore connectivity within metal–organic frameworks by X-ray transmission tomography. Chemical Science, 12(24), 8458–8467. https://doi.org/10.1039/D1SC00607J
- Menon, V. U., Kumaravelu, V. B., Kumar, V. C., Rammohan, A., Chinnadurai, S., Venkatesan, R., Hai, H., & Selvaprabu, P. (2025). AI-powered IoT: A survey on integrating artificial intelligence with IoT for enhanced security, efficiency, and smart applications. IEEE Access. Advance online publication. https://doi.org/10.1109/ACCESS.2025.3551750
- Nguyen, H. D., Tran, P. H., Do, T. H., & Tran, K. P. (2023). Quality control for smart manufacturing in industry 5.0. In T. H. Do & K. P. Tran (Eds.), Artificial intelligence for smart manufacturing: Methods, applications, and challenges (pp. 35–64). Springer. https://doi.org/10.1007/978-3-031-30510-8_3
- Saffie, N. A. M., Shukor, N. A. M., & Rasmani, K. A. (2016). Fuzzy Delphi method: Issues and challenges. In Proceedings of the 2016 International Conference on Logistics, Informatics and Service Sciences (LISS) (pp. 1–7). IEEE. https://doi.org/10.1109/LISS.2016.7854490
- Zhang, X., Kano, M., Tani, J., Mori, J., & Harada, K. (2018). Defect data modeling and analysis for improving product quality and productivity in steel industry. Computer Aided Chemical Engineering, 44, 2233–2238. https://doi.org/10.1016/B978-0-444-64241-7.50367-0
- Laskurain, I., Arana, G., & Heras-Saizarbitoria, I. (2018). Adopting ISO/TS 16949 and IATF 16949 standards: An exploratory and preliminary study. In I. Heras-Saizarbitoria (Ed.), ISO 9001, ISO 14001, and new management standards (Measuring operations performance, pp. 131–143). Springer, Cham. https://doi.org/10.1007/978-3-319-65675-5_8
- Yahyaoui, S., & Zaim, M. (2025). Suppliers re-evaluation for tomorrow’s smart supply chain: AHP approach and performance criteria in automotive industry. Acta Logistica, 12(1). https://doi.org/10.22306/al.v12i1.611
- Krar, S. F., Gill, A., & Smid, P. (2001). Computer Numerical Control Simplified. Industrial Press Inc.
- Chakkour, M. (2018). WIP optimization and lean management deployment – Lear Corporation Trim SA [PowerPoint slides]. SlideShare. https://fr.slideshare.net/slideshow/optimisation-du-wip-et-dploiement-du-lean-management-lear-corporation-trim-sa-112727171/112727171
- Mohd Ridhuan, M. J., Saedah, S., Nurulhuda, M. H., Zaharah, H., Ahmad, A. S., & Nurul, A. R. (2013). Application of Fuzzy Delphi Method in educational research. In S. Siraj, N. Alias, D. DeWitt, & Z. Hussin (Eds.), Design and developmental research (pp. 123–138). Pearson Malaysia.
- Shyamal, A. K., & Pal, M. (2007). Triangular fuzzy matrices. Iranian Journal of Fuzzy Systems, 4(1), 75–87.
- Goswami, S. S., Jena, S., & Behera, D. K. (2022). Selecting the best AISI steel grades and their proper heat treatment process by integrated entropy-TOPSIS decision making techniques. Materials Today: Proceedings, 60, 1130–1139. https://doi.org/10.1016/j.matpr.2022.02.286
- Tang, C. W., & Wu, C. T. (2010). Obtaining a picture of undergraduate education quality: A voice from inside the university. Higher Education, 60, 269–286. https://doi.org/10.1007/s10734-009-9299-5
- James, G., Witten, D., Hastie, T., Tibshirani, R., & Taylor, J. (2023). Linear regression. In An Introduction to Statistical Learning: With Applications in Python (pp. 69–134). Springer. https://doi.org/10.1007/978-3-031-38747-0_3
- Smid, P. (2003). CNC Programming Handbook: A Comprehensive Guide to Practical CNC Programming. Industrial Press Inc.
- Juneja, B. L. (2003). Fundamentals of Metal Cutting and Machine Tools. New Age International.
- Geng, D., Lu, Z., Yao, G., Liu, J., Li, Z., & Zhang, D. (2017). Cutting temperature and resulting influence on machining performance in rotary ultrasonic elliptical machining of thick CFRP. International Journal of Machine Tools and Manufacture, 123, 160–170. https://doi.org/10.1016/j.ijmachtools.2017.08.008
Conflict of Interest Statement
There is no conflict of interest.
Author Contributions
Data Availability Statement
There is no dataset associated with the study.
Supplementary Materials
Table 9*. Simulated dataset - complete observations
|
Observation |
Speed (m×min-1) |
Temperature (°C) |
Vibration (mm×s-1) |
Defects |
|
1 |
51 |
70 |
1,6 |
33,49 |
|
2 |
48 |
68 |
1,87 |
32,91 |
|
3 |
52 |
71 |
2,17 |
34,64 |
|
4 |
49 |
69 |
2,17 |
33,49 |
|
5 |
51 |
71 |
2,09 |
34,57 |
|
6 |
54 |
69 |
1,77 |
33,87 |
|
7 |
47 |
69 |
2,06 |
33,69 |
|
8 |
51 |
71 |
1,88 |
34,56 |
|
9 |
52 |
72 |
2,47 |
35,26 |
|
10 |
49 |
69 |
2,35 |
33,87 |
|
11 |
48 |
69 |
2,22 |
33,97 |
|
12 |
52 |
71 |
1,74 |
34,03 |
|
13 |
52 |
69 |
1,76 |
33,68 |
|
14 |
47 |
69 |
1,54 |
33,20 |
|
15 |
50 |
71 |
2,21 |
34,79 |
|
16 |
49 |
71 |
1,61 |
34,05 |
|
17 |
46 |
68 |
1,94 |
32,92 |
|
18 |
52 |
72 |
1,7 |
34,03 |
|
19 |
50 |
72 |
2,4 |
35,45 |
|
20 |
46 |
69 |
1,98 |
32,92 |
|
21 |
49 |
72 |
2,06 |
34,95 |
|
22 |
45 |
69 |
2,2 |
33,18 |
|
23 |
54 |
68 |
1,64 |
32,81 |
|
24 |
50 |
71 |
2,1 |
33,98 |
|
25 |
53 |
71 |
2,04 |
35,04 |
|
26 |
45 |
71 |
1,7 |
33,01 |
|
27 |
54 |
72 |
2,44 |
35,61 |
|
28 |
47 |
68 |
2,1 |
33,35 |
|
29 |
51 |
72 |
2,19 |
34,79 |
|
30 |
48 |
72 |
2,38 |
35,12 |
|
31 |
53 |
68 |
2,12 |
33,43 |
|
32 |
47 |
68 |
1,8 |
32,65 |
|
33 |
49 |
68 |
1,61 |
32,99 |
|
34 |
47 |
68 |
1,96 |
33,34 |
|
35 |
51 |
71 |
1,72 |
34,25 |
|
36 |
49 |
70 |
1,92 |
33,34 |
|
37 |
53 |
70 |
2,38 |
34,59 |
|
38 |
51 |
68 |
1,82 |
33,49 |
|
39 |
46 |
70 |
1,62 |
33,50 |
|
40 |
48 |
70 |
1,86 |
33,30 |
|
41 |
53 |
68 |
2,41 |
34,11 |
|
42 |
46 |
70 |
1,77 |
33,62 |
|
43 |
54 |
72 |
2,15 |
35,66 |
|
44 |
53 |
69 |
1,5 |
33,06 |
|
45 |
54 |
69 |
1,85 |
33,69 |
|
46 |
49 |
68 |
1,8 |
32,85 |
|
47 |
46 |
71 |
1,66 |
33,32 |
|
48 |
48 |
68 |
2,03 |
33,19 |
|
49 |
51 |
71 |
1,98 |
34,80 |
|
50 |
52 |
69 |
2,19 |
33,71 |