Volume 24 number 1 article 1320 pages:117-129
Received: Mar 11, 2025 Accepted: Dec 14, 2025 Available Online: Feb 01, 2026 Published: Mar 02, 2026
DOI: 10.5937/jaes0-62547
LQR-BASED ACTIVE SEAT SUSPENSION DESIGN TO IMPROVE BUS DRIVER RIDE COMFORT
Abstract
Bus drivers are exposed to vibrations generated by the road surface affecting their fatigue, comfort and health. Vibrations are transmitted from bus wheels to the driver’s body through bus suspension system, bus floor and the seat suspension system. Active and semi-active seat suspensions have been developed to alleviate vibrational negative effects. This paper investigated bus driver ride comfort as a function of bus speeds and road quality considering linear quadratic regulator for active seat suspension system. A 3-degree-of-freedom intercity bus model had been defined for simulation. Bus modelling, controller design and simulations were performed by MATLAB/Simulink software. Results showed that active seat suspension significantly reduces the vertical acceleration transmitted to the driver’s body compared to the passive system. Improvements were particularly noticeable on rough roads and at higher bus speeds.
Highlights
- This study compares bus driver ride comfort for active and passive seat suspension systems.
- Active seat suspension considers controller based on LQR design that penalizes vertical seat displacement, velocity and acceleration.
- Five bus speeds and four different road quality are considered as bus model excitations.
- The proposed model and simulation framework can serve as a basis for further optimization and development of advanced seat suspension.
Keywords
Content
1 Introduction
Bus drivers are exposed to vibrations generated by the road surface. The vibrations are transmitted from the wheels to the driver's body through the bus suspension system, bus floor and seat suspension system, affecting his fatigue, comfort and health. Prolonged exposure to whole-body vibration can lead to spinal and musculoskeletal disorder [1]-[2]. Therefore, understanding and improving the vibration isolation in driver’s seat has become an important research topic in modern bus design.
The driver’s ride comfort depends on several important factors such as road quality, bus parameters, bus velocity and the type of seat suspension system. The passive seat suspension consists of a spring/damper element and provides vibrational isolation above about 6 Hz when loaded with a human adult [2]. Such passive system is unable to provide adequate vibration isolation at lower excitation frequencies or under varying loading and road conditions [3]. Semi-active and active seat suspensions have been developed to overcome these limitations. These suspension systems enable adjustment of the shock-absorber damping or generation of an additional control (active) force that alleviates road-induced vibrations.
Numerous control strategies have been developed for active and semi-active seat suspensions. The sky-hook control concept became one of the most widely adopted due to its simplicity and effectiveness in reducing vertical acceleration [4]. Ground-hook and hybrid sky-ground-hook control laws have been implemented to improve both ride comfort and seat suspension deflection [5]. Other classical methods, such as Proportional-Integral-Derivative (PID) and linear quadratic regulator (LQR) control have also been investigated [6]-[8]. Sliding mode control algorithm and a neural-based damper controller improved control performance criteria such as seat travel distance and seat acceleration [9]. Model predictive control (MPC) has recently attracted attention for its ability to handle multivariable constraints and preview road information [10]. Most studies have focused on passenger cars, trucks, and agricultural vehicles, while relatively little research has been conducted on bus driver seat suspension systems.
In this paper, linear 3-degree-of-freedom (DOF) bus model is developed to analyze the driver’s ride comfort for both passive and active seat suspension configurations. The active seat system is modelled considering LQR controller designed to affect three kinematic values (vertical seat displacement, velocity and acceleration). Driver’s ride comfort is analyzed for five bus speeds and for four different longitudinal road roughness. Standard ISO 8608 has been used for road roughness modelling. Bus modelling, controller design and simulations were performed by MATLAB/Simulink software.
2 Materials and methods
2.1 In-line bus model
Linear bus quarter three DOF model with active seat suspension is considered (Fig. 1). Bus parameters values for a quarter model are given in Table 1 [11] and refer to an intercity bus [12].
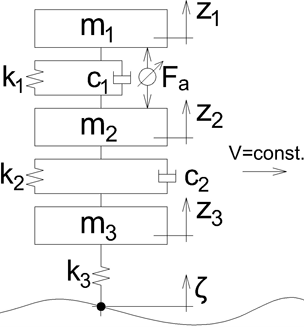
Fig. 1. Three DOF bus model with active seat suspension system [11]
Table 1. Bus parameters [11]
|
Bus parameters |
Values |
|
m1 - mass of a bus seat (20 kg) and mass of a driver (80 kg) |
100 [kg] |
|
m2 - bus sprung mass |
4000 [kg] |
|
m3 - bus unsprung mass |
550 [kg] |
|
k1 - driver’s seat suspension spring stiffness |
20000 [N/m] |
|
k2 - suspension spring stiffness |
320000 [N/m] |
|
k3 - tyre radial stiffness |
1700000 [N/m] |
|
c1 - driver’s seat shock absorber damping |
1000 [Ns/m] |
|
c2 - suspension shock absorber damping |
10000 [Ns/m] |
|
ka - actuator gain |
650 [N/control unit] |
|
Ta - actuator time constant |
0.03 [s] |
Based on parameters values from Table 1, damped natural frequencies for bus masses vertical oscillations are calculated and presented in Table 2. It could be noticed that calculated natural frequencies values correspond to typical values of mass frequencies for heavy vehicle [13].
Table 2. Damped natural frequencies for vertical oscillations of the bus masses
|
Bus masses |
Damped natural frequencies [Hz] |
|
m1 - mass of a seat with a driver |
1.2791 |
|
m2 - bus sprung mass |
2.1403 |
|
m3 - bus unsprung mass |
9.4987 |
Differential equations of motion for the oscillatory system shown in Fig. 1, according to second Newton’s law, are presented by equations (1-3)
where Fa - active (actuator) force given by the first-order dynamics model [14], equation (4)
| $\dot{F}_a = -\frac{1}{T_a} F_a + \frac{k_a}{T_a} u$ | (4) |
where Ta - actuator time constant; ka - steady-state actuator gain. Values of these actuator parameters are taken from the literature [14] and presented in Table 1. These parameters could be realized with an electromechanical actuator with a bandwidth sufficient to address the dominant vibration frequencies relevant to ride comfort (1÷8 Hz). The force capability is consistent with the requirements of a typical seat-occupant mass and ensures effective vibration suppression without excessive actuator saturation (see Fig. 11).
Differential equations (1-3) are presented in the state-space form given by equations (5-6)
| $\dot{x} = A \cdot x + B \cdot u + H \cdot d$ | (5) |
| $y = C \cdot x + D \cdot u$ | (6) |
where A - dynamics matrix; B - the control matrix; H - disturbance matrix; x - the state vector; u - the normalized input signal ($u \in [-1, 1]$); d - the disturbance signal (road roughness - ζ); C - output matrix; D - feedthrough matrix; y - the output signal.
State vector is given by equation (7)
| $x = \begin{bmatrix} x_1 & x_2 & x_3 & x_4 & x_5 & x_6 & x_7 \end{bmatrix}^{T} = \begin{bmatrix} z_1 & \dot{z}_1 & z_2 & \dot{z}_2 & z_3 & \dot{z}_3 & F_a \end{bmatrix}^{T}$ | (7) |
In this work, active seat system should improve bus driver’s ride comfort. Therefore, three kinematic values (seat vertical displacement ($z_1$), seat vertical velocity ($\dot{z}_1$) and seat vertical acceleration ($\ddot{z}_1)) are chosen as output signals. The output signal is given by equation (8)
| $y = \begin{bmatrix} y_1 \\ y_2 \\ y_3 \end{bmatrix} = \begin{bmatrix} z_1 \\ \dot{z}_1 \\ \ddot{z}_1 \end{bmatrix}$ | (8) |
Full state-space model is described by equations (9-10)
| $\dot{x} = \begin{bmatrix} 0 & 1 & 0 & 0 & 0 & 0 & 0 \\ -\frac{k_1}{m_1} & -\frac{c_1}{m_1} & \frac{k_1}{m_1} & \frac{c_1}{m_1} & 0 & 0 & \frac{1}{m_1} \\ 0 & 0 & 0 & 1 & 0 & 0 & 0 \\ \frac{k_2}{m_2} & \frac{c_2}{m_2} & -\frac{k_1+k_2}{m_2} & -\frac{c_1+c_2}{m_2} & \frac{k_1}{m_2} & \frac{c_1}{m_2} & -\frac{1}{m_2} \\ 0 & 0 & 0 & 0 & 0 & 1 & 0 \\ 0 & 0 & \frac{k_2}{m_3} & \frac{c_2}{m_3} & -\frac{k_2+k_3}{m_3} & -\frac{c_2}{m_3} & 0 \\ 0 & 0 & 0 & 0 & 0 & 0 & -\frac{1}{T_a} \end{bmatrix} \begin{bmatrix} x_1 \\ x_2 \\ x_3 \\ x_4 \\ x_5 \\ x_6 \\ x_7 \end{bmatrix} + \begin{bmatrix} 0 \\ 0 \\ 0 \\ 0 \\ 0 \\ 0 \\ \frac{k_a}{T_a} \end{bmatrix} u + \begin{bmatrix} 0 \\ 0 \\ 0 \\ 0 \\ 0 \\ \frac{k_3}{m_3} \\ 0 \end{bmatrix} \zeta$ | (9) |
| $y = \begin{bmatrix} 1 & 0 & 0 & 0 & 0 & 0 & 0 \\ 0 & 1 & 0 & 0 & 0 & 0 & 0 \\ -\frac{k_1}{m_1} & -\frac{c_1}{m_1} & \frac{k_1}{m_1} & \frac{c_1}{m_1} & 0 & 0 & \frac{1}{m_1} \end{bmatrix} x + \begin{bmatrix} 0 & 0 \\ 0 & 0 \\ 0 & 0 \end{bmatrix} \begin{bmatrix} \zeta \\ u \end{bmatrix}$ | (10) |
2.2 LQR controller design
The problem of LQR design is to find control law (u) that minimizes quadratic cost function given system dynamics equations (5-6). Quadratic cost function is described by equation (11):
| $J = \int_0^{\infty} \left( x^T Q_x x + u^T Q_u u \right) dt $ | (11) |
where $Q_x$ - the positive semidefinite matrix (states weighting matrix); $Q_u$ - positive definite matrix (control weighting matrix); $x^T Q_x x$ - the state cost, and $u^T Q_u u$ - the control cost.
The solution of LQR problem is a controller signal, equation (12)
| $u = -K \cdot x$ | (12) |
where K - the optimal feedback gain, calculated by equation (13)
| $K = Q_u^{-1} B^T S$ | (13) |
where S - positive definite symmetric matrix obtained as solution of algebraic Riccati equation (14)
| $A^T S + S A - S B Q_u^{-1} B^T S + Q_x = 0$ | (14) |
In this work, three kinematic values are penalized (equation (8)), and cost function takes the form presented by equation (15)
| $J = \int_0^\infty \left( y^T Q_y y + u^T Q_u u \right) dt = \int_0^\infty \left( x^T C^T Q_y C x + u^T Q_u u \right) dt = \int_0^\infty \left( x^T Q_x x + u^T Q_u u \right) dt $ | (15) |
Diagonal weighting matrices $Q_y$ and $Q_u$ are given by equations (16-17)
| $Q_y = \begin{bmatrix} q_1 & 0 & 0 \\ 0 & q_2 & 0 \\ 0 & 0 & q_3 \end{bmatrix} $ | (16) |
| $Q_u = [\gamma_1] $ | (17) |
where $q_1$, $q_2$, $q_3$ - individual diagonal weights for the chosen outputs; $\gamma_1$ - individual weight for the control signal.
Bryson’s rule is employed when defining individual weights for both diagonal weighting matrices ($Q_y$ and $Q_u$) [15], according to equations (18-19)
| $q_i = \frac{\alpha_i^2}{y_{i,\text{max}}^2} $ | (18) |
where $\alpha_i $ - additional individual weighs of the outputs; $y_{1 \text{max}}$, $y_{2 \text{max}}$, $y_{3 \text{max}}$ - maximal values of the seat vertical displacement, velocity and acceleration, respectively (chosen values are $y_{1 \text{max}} = 0.05 \ \text{m}, \quad y_{2 \text{max}} = 0.5 \ \text{m/s}, \quad y_{3 \text{max}} = 5 \ \text{m/s}^2$).
| $\gamma_1 = \frac{\delta_1^2}{u_{1 \text{max}}^2}$ | (19) |
where $\delta_1$ - the additional individual weight of the control input; $u_{1 \text{max}}$ - maximum value of the normalized input signal, therefore $u_{1\text{max}} = \pm 1$.
The maximum seat vertical displacement is set to 0.05 m, and it is consistent with the typical stroke limits of commercial seat suspension systems and acceptable spinal motion [16]. The velocity limit of 0.5 m/s corresponds to upper-bound transient seat velocities reported in the literature for severe road excitations [17]. The maximum acceleration is chosen as 5 m/s² and represents a conservative peak limit that remains consistent with ISO 2631/1997 comfort criteria (given in Table 4) when interpreted as a transient rather than RMS acceleration [17], [20]. These bounds ensure that the controller prioritizes driver comfort while maintaining physically realistic motion constraints.
Additional individual weights should meet the conditions given by equations (20-21)
| $\sum\limits_{i=1}^{3} \alpha_i^2 = 1$ | (20) |
| $\sum\limits_{i=1}^{1} \delta_i^2 = 1$ | (21) |
Chosen values for the additional individual weights for $Q_y$ matrix are $α_1=α_2=0.4243; α_3=0.8$. Value for the additional individual weight for $Q_u$ matrix, according to equation (21), is $\delta_1 = 1$.
The optimal feedback gain K is calculated by MATLAB built-in function “LQR”, and the values for each state are presented in the row vector by equation (22)
| $K = \begin{bmatrix} k_{11} & k_{12} & k_{13} & k_{14} & k_{15} & k_{16} & k_{17} \end{bmatrix} = \begin{bmatrix} -15.4637 & 0.4630 & 28.2298 & 0.9464 & 1.2928 & 0.0371 & 0.0009 \end{bmatrix} $ | (22) |
Fig. 2 shows bus driver’s seat model with active and passive (no active force Fa in equations (1-2)) suspension systems in MATLAB/Simulink software considering vertical dynamic and LQR equations in this Chapter. Saturation block (in the active seat suspension model) limits the values of the input signal to ±1, therefore holding active force Fa values within realistic ones.
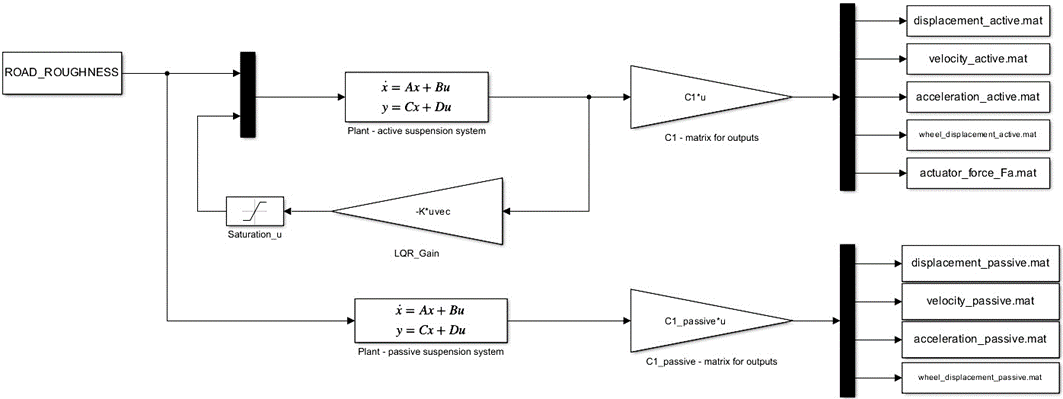
Fig. 2. Bus model with active and passive bus driver’s seat suspension systems
2.3 Road roughness - bus model excitations
Bus model was excited by four road roughness of different quality modelled by power spectral density (PSD) of road displacement defined in standard ISO 8608 [17]. The PSD is given by equation (23)
| $\Phi_\zeta(n) = \Phi_\zeta(n_0) \cdot \left( \frac{n}{n_0} \right)^{-w}$ | (23) |
where Φζ(n) - the PSD of road roughness (m2/(cycles/m)); Φζ(n0) - unevenness index (m2/(cycles/m)); n0 - reference spatial frequency (n0=0.1 (cycles/m)); w - waviness (-).
The unevenness index characterizes the quality of road roughness. Higher unevenness coefficient values signify a poorer condition of the road. The waviness parameter illustrates the distribution of short and long wavelengths within the road displacement spectrum. In accordance with standard ISO 8608, the standard value for parameter w is 2, which reflects a comparable ratio of short to long wavelengths in the road spectrum [18].
In this work, the longitudinal road roughness on one track was modelled as a function of distance using PSD, equation (24)
| $\zeta(x) = \sum_{i=1}^{N} A_i \cos\left( 2 \pi n_i x + \beta_i \right) = \sum_{i=1}^{N} \sqrt{2 \, \Delta n \, \Phi_\zeta(n_i)} \, \cos\left( 2 \pi n_i x + \beta_i \right) $ | (24) |
where ζ(x) - longitudinal road roughness (m); N - the number of harmonics; Ai - the discrete amplitudes of excitation (m); ni - discrete spatial frequency (cycles/m); x - distance (m); βi - the independent random phase angles uniformly distributed in the interval (0, 2𝜋)); ∆n - spatial frequency step (cycles/m); Φζ(ni) - PSD for discrete spatial frequency (m2/(cycles/m)). A detailed procedure for road roughness modelling is described in [11], [19].
The values of important parameters for generating longitudinal road roughness depending on the unevenness index are shown in Table 3.
Table 3. Parameters for longitudinal road roughness generation
|
Reference spatial frequency |
Unevenness index |
Waviness |
|
n0 (cycles/m) |
Φζ(n0) (m2/(cycles/m)) |
w (-) |
|
0.1 |
8·10-6 (A-road class) |
2 |
|
16·10-6 (B-road class) |
||
|
128·10-6 (C-road class) |
||
|
512·10-6 (D-road class) |
Fig. 3a shows the modelled road roughness as a function of distance (250 m distance is considered). Road roughness amplitudes for A-road class are in the range ±0.010 m, whereas for D-road class in the range ±0.060 m (Fig. 3a). Fig. 3b shows modelled road roughness as a function of spatial frequency in ISO 8608 standard.
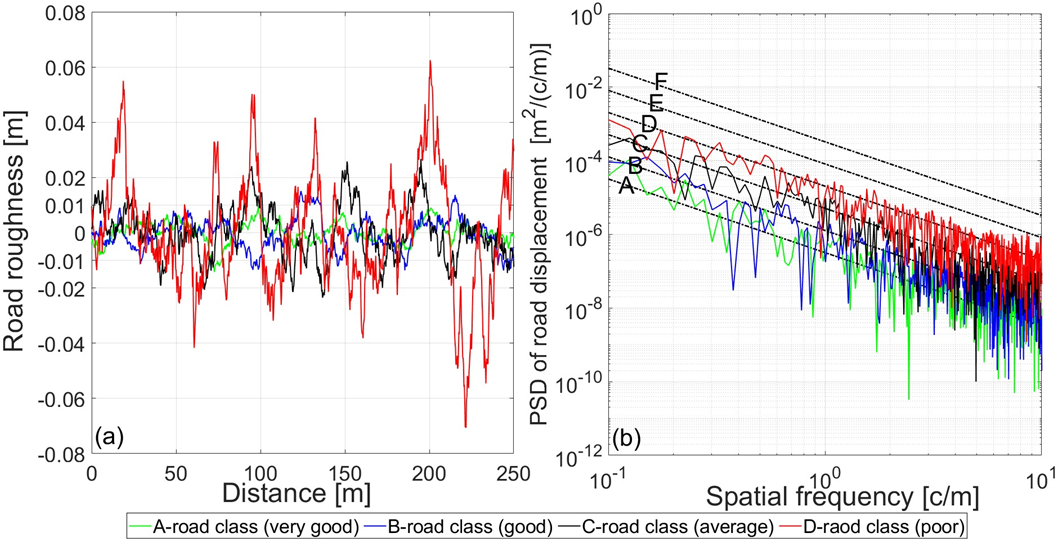
Fig. 3. Longitudinal road roughness as a function of a) distance, b) spatial frequency
2.4 ISO 2631 standard
The ISO 2631/1997 standard defines methods for quantifying vibrations of the whole human body and assessing the effects of vibrations on health, comfort, perception and occurrence of seasickness [20]. The standard applies to vibrations acting on the human body in a standing position (through the legs), a sitting position (through the seat, back and legs) and a lying position (through back).
The paper analyzes the impact of vertical vibrations on the driver's comfort, which are transmitted to his body through the seat surface. The relevant value for assessing vibrational effects on ride comfort, according to ISO 2631/1997, is the root mean square (RMS) value of the weighted vertical acceleration, equation (25)
| $\ddot{z}_{w,\text{RMS}} = \sqrt{ \frac{1}{T} \int_0^T \left( \ddot{z}_{w,\text{seat}}(t) \right)^2 \, dt } $ | (25) |
where z̈w,RMS – the RMS value of the weighted vertical acceleration (m/s2); z̈w,seat(t) - weighted vertical acceleration (m/s2); T - simulation time (s).
The filter Wk has been used for seat vertical acceleration weighting, according to ISO 2631/1997 (Fig. 4a). The weighting filter reflects the human body’s sensitivity to vibrations, depending on frequencies. The human body is the most sensitive to vertical acceleration in the frequency range of 4÷8 Hz. Outside this range, sensitivity decreases with the frequency decrease below 4 Hz and with the frequency increase above 8 Hz. Consequently, the transfer function filter module Wk for frequencies in the range 4÷8 Hz is equal to unity (Fig. 4a). The frequency-weighting curve Wk was defined in MATLAB script considering analytical expressions given in annex A of ISO 2631-1 standard [20]. MATLAB built-in function ‘‘bilinear’’ was employed for the analog-digital transformation of the band-limiting transfer function and the actual weighting transfer function.
As an example, Fig. 4b shows the raw and weighted vertical acceleration for passive and active seat suspension for a B-road class and a bus speed of 100 km/h. It could be noticed that the weighted acceleration is of lower value than the raw acceleration.
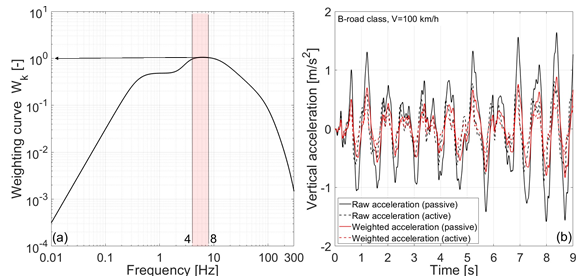
Fig. 4. Vertical acceleration weighting a) frequency-weighting curve Wk, b) raw and weighted accelerations for passive and active seat suspension systems
Table 4 presents oscillatory comfort criteria in public means of transport according to ISO 2631/1997 [20].
Table 4. Ride comfort criteria in public means of transport [20]
|
Vibration intensity [m/s2] |
Ride comfort assessment |
|
< 0.315 |
comfortable |
|
0.315 − 0.63 |
a little uncomfortable |
|
0.5 − 1.0 |
fairly uncomfortable |
|
0.8 − 1.6 |
uncomfortable |
|
1.25 − 2.5 |
very uncomfortable |
|
> 2.0 |
extremely uncomfortable |
3 Results and discussion
Five bus speeds and four road roughness of different quality were considered in analysis of bus driver’s ride comfort. For a very good road (A-road class), bus speeds of 40 km/h, 60 km/h, 80 km/h, 100 km/h and 120 km/h were considered; for a good road (B-road class), bus speeds of 40 km/h, 60 km/h, 80 km/h and 100 km/h were considered; for an average road (C-road class), bus speeds of 40 km/h, 60 km/h and 80 km/h were considered; and for a poor road (D-road class), bus speeds of 40 km/h and 60 km/h were considered.
3.1 Analysis of vertical tyre forces
The constrained force between bus wheel and road is comprised of a static and dynamic part, equation (26)
| $Z(t) = Z_{\text{st}} + Z_{\text{dyn}}(t) = (m_1 + m_2 + m_3) \, g + k_3 (z_3 - \zeta) $ | (26) |
where Z(t) - a total vertical tyre force (N); Zst - a static tyre force (N), and Zdyn(t) - a dynamic tyre force (N). Total vertical force is equal to zero when Zdyn(t) = -Zst and there had been a loss of contact between the bus wheel and the road. Fig. 5 shows total vertical forces as a function of distance for different road quality (A, B, C and D-road class) and different bus speeds (60, 80, 100 and 120 km/h). Dynamic part of the vertical tyre force increases with the bus speed and with poor road conditions. However, the total forces have positive values, meaning that contact has not been lost. It could be noticed that active seat suspension does not have an influence on vertical tyre forces values.
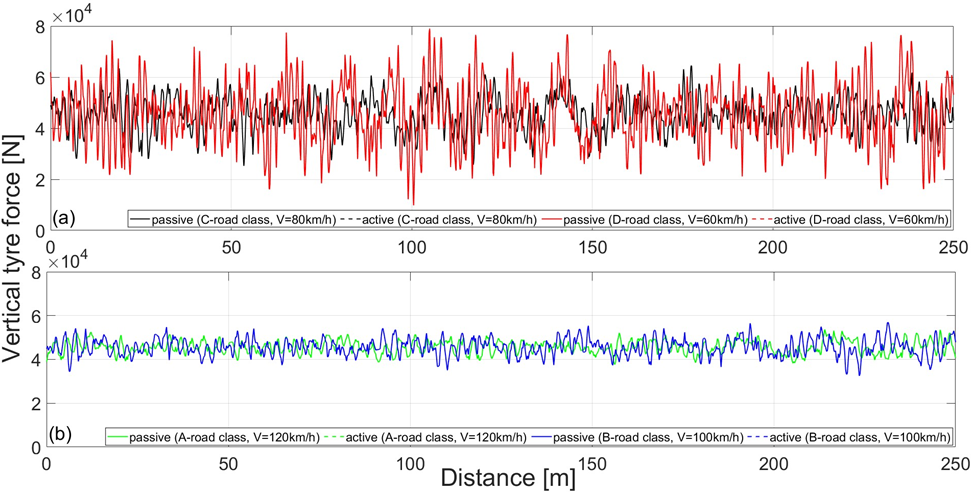
Fig. 5. Vertical tyre force for a) C-road class (V=80 km/h) and D-road class (V=60 km/h), b) A-road class (V=120 km/h) and B-road class (V=100 km/h), as a function of distance
Permanent contact between bus wheel and road is a prerequisite for using the differential equations of motion (equations (1-3)) for the defined bus oscillatory three DOF model.
3.2 Analysis of bus driver’s ride comfort
Fig. 6 shows the vertical acceleration of the bus driver’s body for passive and active seat suspension system as a function of distance, road class and bus velocity. The driver is exposed to higher acceleration values in a seat with passive suspension than in a seat with active suspension system. The acceleration increases with bus speed and with poorer road conditions. For example, for a bus speed of 60 km/h, the highest vertical acceleration values are on a D-road class (Fig. 6d).
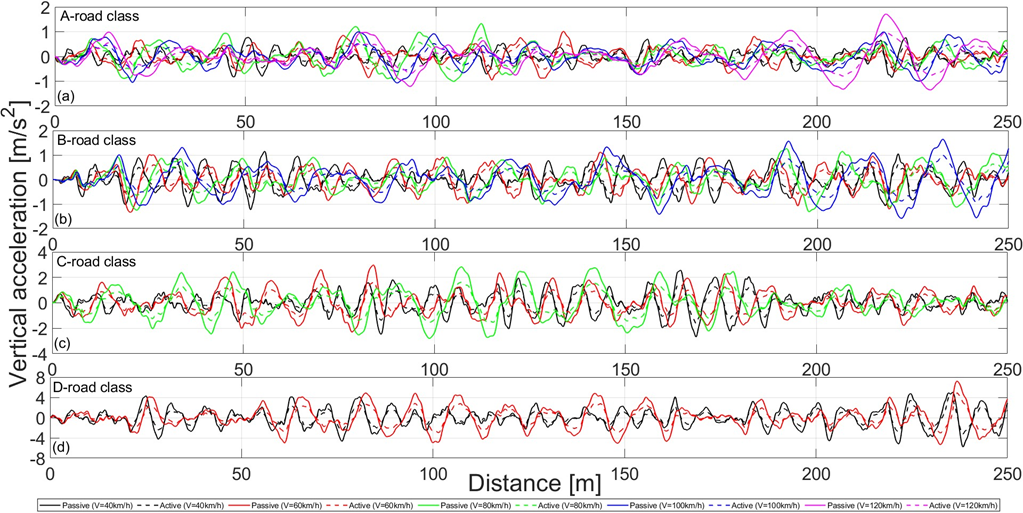
Fig. 6. Vertical driver’s acceleration for a) A-road class, b) B-road class, c) C-road class, d) D-road class, as a function of distance
Fig. 7 shows the PSD of the raw and weighted vertical acceleration for passive and active seat suspension system for B-road class (V=100 km/h) and for D-road class (V=60 km/h). The vibration intensities are distributed in the frequency range 0÷4 Hz and have lower values for the active seat suspension system. The maximum value of the PSD for both suspension systems is about 1.3 Hz (resonant frequency of a bus seat with a driver, Table 2). Both seats attenuate vertical vibrations at frequencies above 4 Hz. This is important since the human body is most sensitive to vertical vibrations in the frequency range 4÷8 Hz [21].
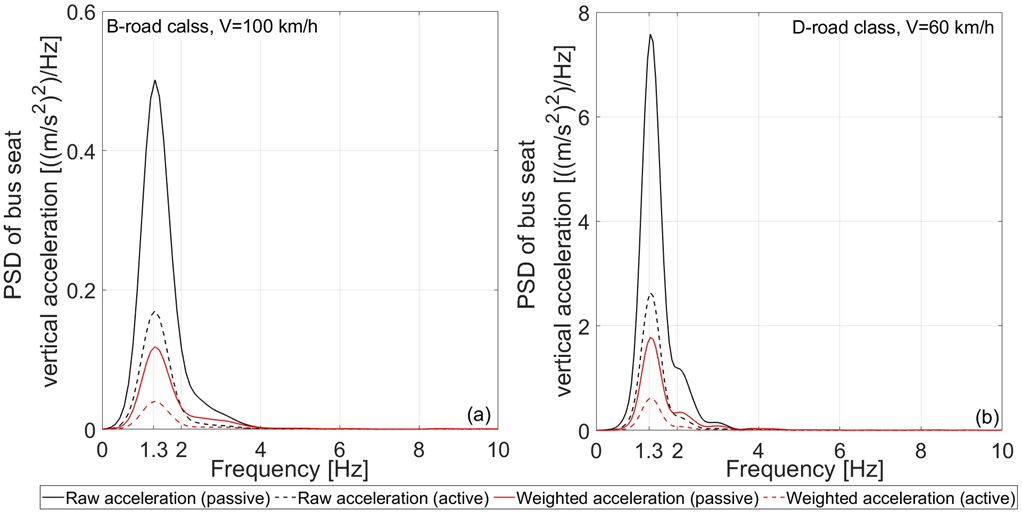
Fig. 7. PSD of the vertical driver’s acceleration for passive and active seat suspension systems for a) B-road class and V=100 km/h, b) D-road class and V=60 km/h
Fig. 8 presents the RMS values of the weighted vertical acceleration for passive and active seat suspension system as a function of considered bus speeds. The RMS values of vertical acceleration increase with the bus velocity for both suspension systems. Active seat suspension provides lower RMS values, therefore better bus driver’s ride comfort. For example, for the B-road class, the driver feels a little uncomfortable at a bus velocity of 87 km/h with the passive seat suspension system. For the B-road class, vertical vibrations have no effect on the driver’s ride comfort in the case of the active seat system. Moreover, with the seat active suspension, the driver feels comfortable even at a bus speed of 120 km/h. For the C-road class, the driver gets fairly uncomfortable for the passive seat system at a bus speed of 50 km/h, while he feels a little uncomfortable for the active seat system at a speed of 63 km/h. For the D-road class and for both bus speeds (40 km/h and 60 km/h), the driver feels uncomfortable with the passive seat system, and fairly uncomfortable with the active seat system.
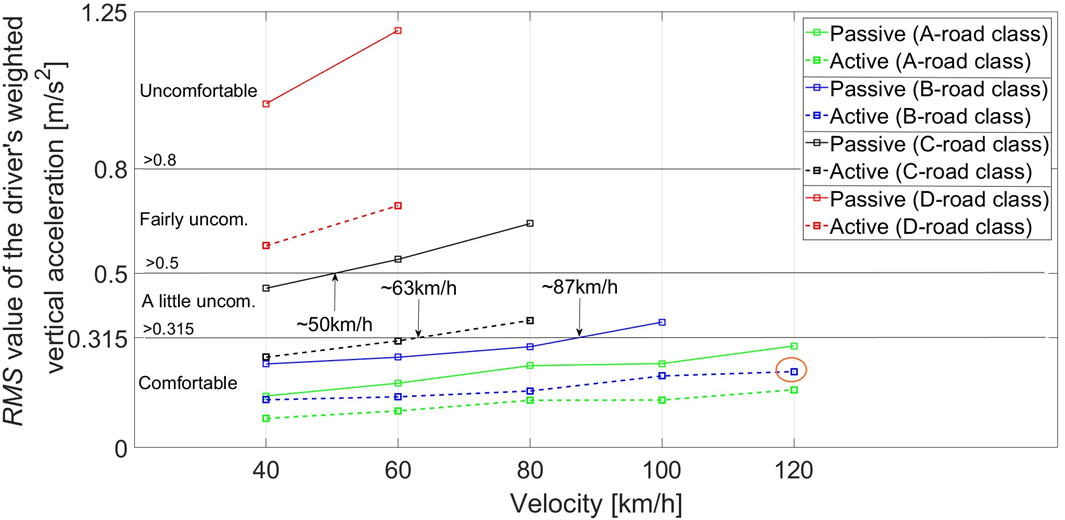
Fig. 8. RMS value of the weighted vertical acceleration for passive and active seat suspension systems
Fig. 9 presents the vertical displacement and vertical velocity for the passive and active seat suspension systems. The active suspension system provides lower values of vertical displacement (Fig. 9a) and lower values of vertical velocity (Fig. 9b). It should be noted that the peak minimum/maximum displacement values are approximately ±0.05 m (Fig. 9a), while for velocity they are ±0.5 m/s (Fig. 9b). This is in accordance with the maximum displacement/velocity values set when designing the LQR controller in Chapter 2.2.
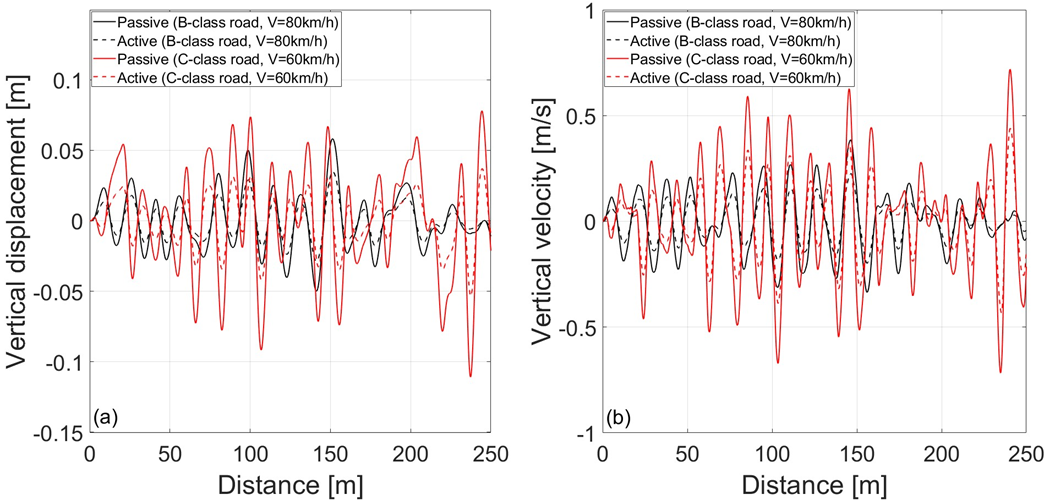
Fig. 9. Seat vertical a) displacement, b) velocity, for passive and active seat suspension systems
Fig. 10 presents the RMS value of seat vertical displacement and velocity for passive and active seat suspension systems. The RMS value of the seat vertical displacement increases with bus speed for both seat suspension system (Fig. 10a). The active seat system provides lower RMS values for each road class (Fig. 10a). The RMS value of the seat vertical velocity increases with bus speed for both seats (Fig. 10b). The active seat system provides lower RMS velocity values for each road class (Fig. 10b).
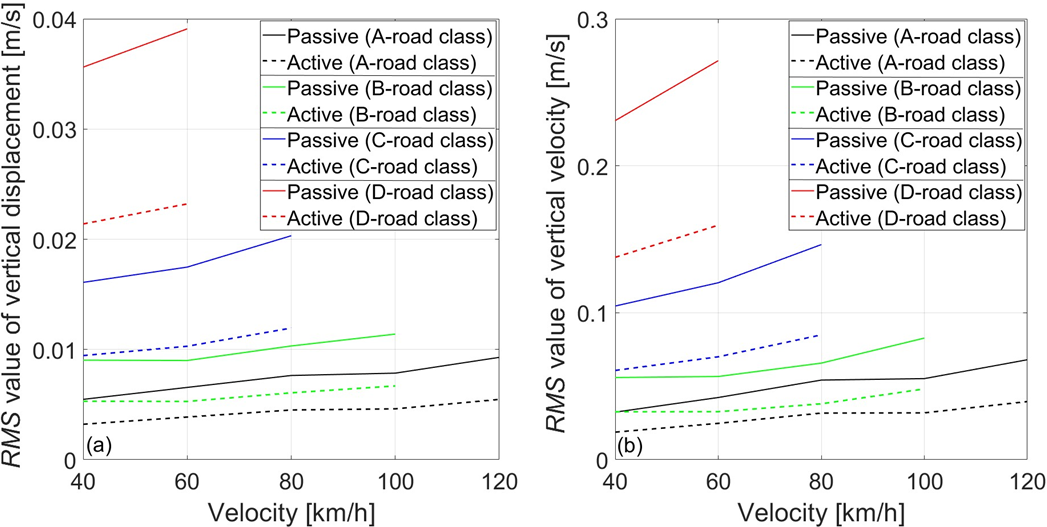
Fig. 10. RMS values of seat vertical a) displacement, b) velocity, for passive and active seat suspension systems
3.3 Control input and seat active force
Fig. 11 presents an example of normalized actuator signal value as function of distance. Actuator signal value increases with bus velocity and with poorer road quality. For example, for B-road class and bus velocity of 100 km/h signal values are in the range ±0.3. For C-road class and bus velocity of 80 km/h signal values are in the range ±0.5. For D-road class and bus velocity of 40 km/h and 60 km/h control signal reached saturation values of ±1.
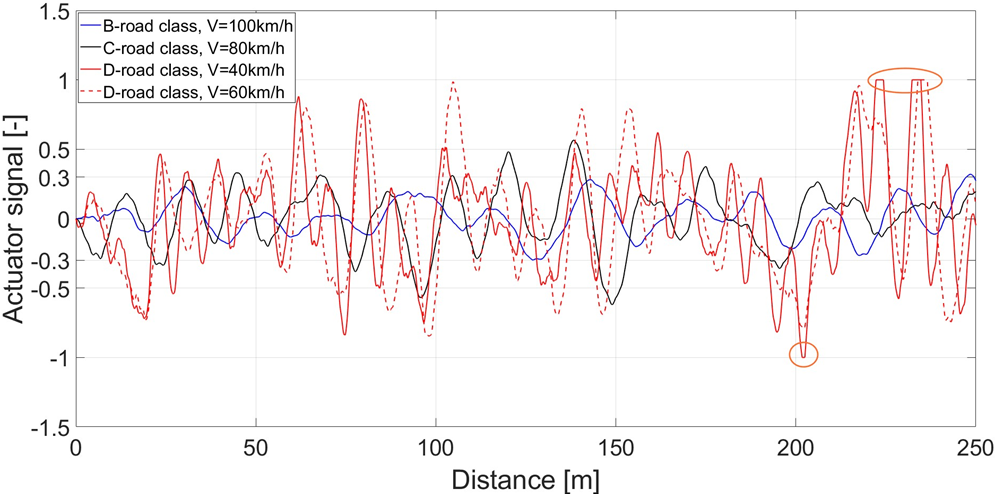
Fig. 11. Normalized actuator signal as a function of distance, road class and bus velocity
Fig. 12 presents an example of an active seat force that actuator should provide as a function of distance. Active seat force value increases with bus speed and with poorer road quality. For poor road quality, active force reached maximum values of ±650 N at bus velocity of 40 km/h and 60 km/h (Fig. 12b). Commercial electromechanical linear actuators capable of generating forces up to ±650 N and more are widely available. For example, standard 24 V DC linear actuators with nominal forces of 750 N to 1000 N are used for active seating applications (e.g. VEVOR 1000 N and 750 N actuators). Therefore, proposed actuator force range for the controller model defined in this work is feasible with real hardware. For the proposed actuator force limit of ±650 N and a maximum seat velocity of 0.5 m/s the peak mechanical power requirement would be around 325 W.
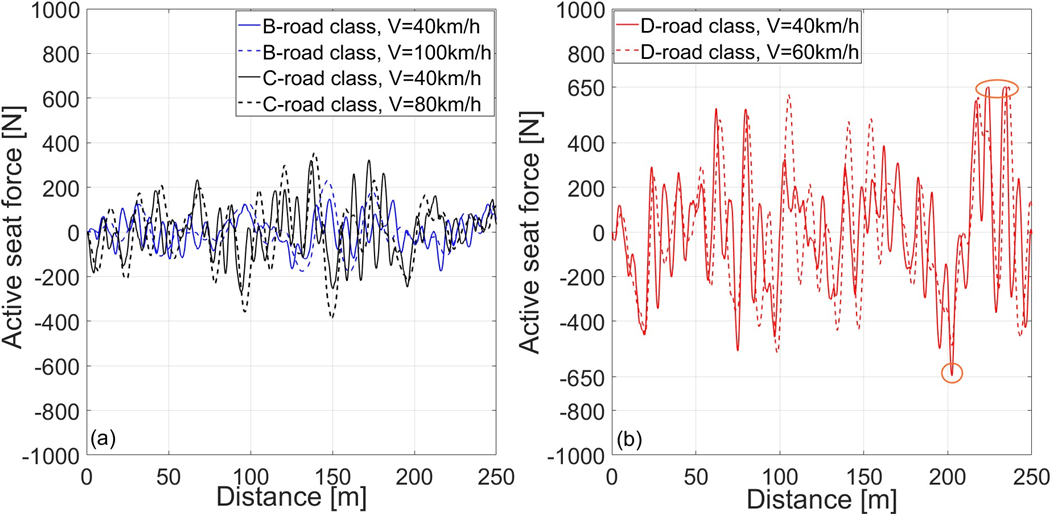
Fig. 12. Active force for a) B-road class and C-road class, b) D-road class, as a function of distance
3.4 Robustness of LQR controller
Long-term cyclic loading causes wear on the seat suspension system which is reflected in a gradual decrease in stiffness and damping. Fig. 13 shows the RMS value of the weighted vertical acceleration for passive and active seat suspension systems as a function of spring stiffness and shock-absorber damping coefficients. The ride comfort of the bus driver decreases with seat wear i.e. with a decrease in stiffness and damping for passive seat suspension. For example, for a D-road class and a bus speed of 60 km/h, the driver feels very uncomfortable in the case of the severe seat wear (stiffness of 10000 N/m and damping of 500 Ns/m which is reductions of 50 % of their nominal values, Fig. 13d). It could be noticed that active seat suspension compensates for seat wear and provides significantly better driver’s ride comfort for each road quality and for each bus speed.
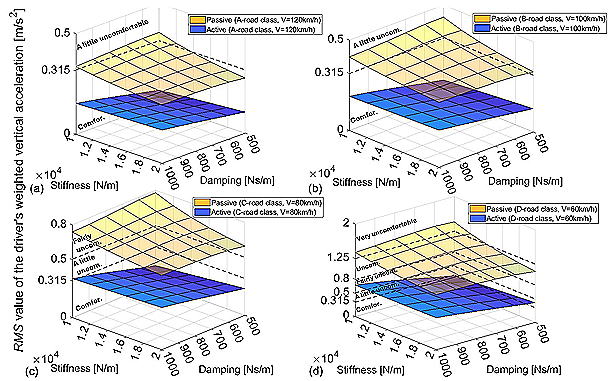
Fig. 13 RMS value of the weighted vertical acceleration for passive and active seat suspension systems for a) A-road class and V=120 km/h, b) B-road class and V=100 km/h, c) C-road class and V=80 km/h, d) D-road class and V=60 km/h, as a function of seat stiffness and damping coefficients
Fig. 14 shows the RMS value of the weighted vertical acceleration for passive and active seat suspension systems as a function bus driver’s mass. The RMS value increases slightly with driver’s mass for the passive seat suspension system. The RMS value does not change with driver’s mass for the active seat suspension system. Also, the RMS values of the weighted vertical acceleration for the active seat are lower than for the passive seat for each road class and for each bus speed. These results show that the proposed LQR controller exhibits strong robustness to driver mass uncertainty.
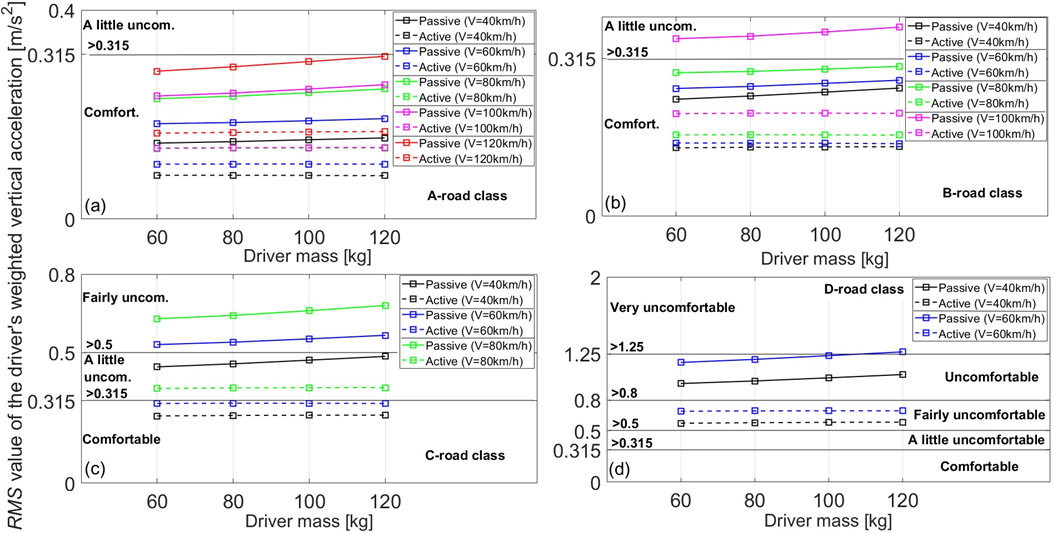
Fig. 14 RMS value of the weighted vertical acceleration for passive and active seat suspension systems for a) A-road class, b) B-road class, c) C-road class, d) D-road class, as a function of bus driver’s mass
4 Conclusion
This paper compares performance criteria (vertical seat displacement, velocity and acceleration) for active and passive bus driver’s seat suspension systems. The active seat system is based on LQR controller. The analysis considers five bus speeds (V=40, 60, 80, 100 and 120 km/h) and four longitudinal road roughness of different quality (A, B, C and D-road class).
Conclusions from this research are as follows:
- The dynamic part of the vertical tyre force increases with bus speed and poorer road conditions, but there is no loss of contact between the wheel and the road.
- The seat vibration intensities are distributed in the frequency range 0÷4 Hz and have lower values for the active seat suspension system.
- The RMS values of the weighted vertical acceleration increase with the bus velocity for both suspension systems. Active seat suspension provides lower RMS values, therefore better bus driver’s ride comfort.
- For B-road class a driver feels a little uncomfortable at the bus velocity of 87 km/h with passive seat suspension system. For B-road class, vertical vibration does not have an influence on driver’s ride comfort in the case of active seat system.
- The results show that the LQR-based active seat suspension significantly reduces the vertical acceleration transmitted to the driver body compared to the passive system. The improvements are particularly noticeable on rough roads (e.g. D-road class) and at higher bus velocities (e.g. 100 km/h and 120 km/h).
- Active suspension system provides lower values of vertical displacement and lower values of vertical velocity. The peak maximum/minimum displacement values approximately amount to ±0.05 m, whereas for velocity amount to ±0.5 m/s.
- The value of the actuator signal increases with bus speed and with poorer road quality. For D-road class and for the bus velocities of 40 km/h and 60 km/h control signal reached values of ±1.
- Active seat force value increases with bus speed and with poorer road quality. For poor road quality, active force reached maximum/minimum values of ±650 N at bus velocities of 40 km/h and 60 km/h.
- The proposed LQR controller is robust with respect to seat wear and driver mass uncertainties.
The proposed model and simulation framework can serve as a basis for further optimization, hardware-in-the-loop testing, and development of advanced seat suspension systems for bus drivers. Future work could consider a comparative analysis of bus driver ride comfort between active seat suspensions based on the proposed LQR controller and different controller methods (e.g. sky-hook, PID, MPC). Future work could also investigate influence of shock vibration (e.g. from road humps/bumps) on bus driver’s health considering passive and active seat with the proposed LQR controller.
Acknowledgements
Support for this research was provided by the Ministry of Education, Science and Technological Development of the Republic of Serbia under Grant No. TR36027. This support is gratefully acknowledged.
References
- Paddan, G. S., Griffin, M. J. (2002). Evaluation of whole-body vibration vehicles. Journal of Sound and Vibration, 253 (1), 195-213. https://doi.org/10.1006/jsvi.2001.4256
- Mansfield, N. J. (2005). Human response to vibration. CRC Press, Boca Raton London New York Washington, D.C.
- Hrovat, D. (1997). Survey of Advanced Suspension Developments and Related Optimal Control Application. Automatica, 33 (10), 1781-1817. https://doi.org/10.1016/S0005-1098(97)00101-5
- Karnopp, D., Crosby, M. J., Harwood, R. A. (1974). Vibration control using semi-active force generators. Journal of Engineering for Industry, 96 (2), 619-626. https://doi.org/10.1115/1.3438373
- Alleyne, A., Hedrick, J. K. (1995). Nonlinear adaptive control of active suspensions. IEEE Transactions on Control Systems Technology, 3 (1), 94-101. https://doi.org/10.1109/87.370714
- Sekulić, D., Dedović, V. (2008). Simulation of the oscillatory behavior of buses equipped with a classic and active suspension system. Journal of Applied Engineering Science, 6 (20), 23-32. https://www.engineeringscience.rs/articles/volume-6-article-128
- Chen, X. et al. (2002). Ride comfort investigation of semi-active seat suspension integrated with quarter car model. Mechanics & Industry, 23 (18), 1-17. https://doi.org/10.1051/meca/2022020
- Putra, S. M. S. M. et al. (2018). Linear Quadratic Regulator Based Control Device for Active Suspension System with Enhanced Vehicle Ride Comfort. Journal of the Society of Automotive Engineers Malaysia, 2 (3). 289-305. https://doi.org/10.56381/jsaem.v2i3.97
- Metered, H., Bonello, P., Oyadiji, S. O. (2009). Vibration Control of a Seat Suspension System Using Magnetorheological Damper. In Proceedings of the ASME 2009 International Design Engineering Technical Conferences and Computers and Information in Engineering Conference (pp. 1021-1029). San Diego, CA, USA. https://doi.org/10.1115/DETC2009-86081
- Zhao, S. et al. (2023). Research on Tractor Active Seat Suspension Based on Model Predictive Control. EEE Access, Volume 11, 117078-117093. https://doi.org/10.1109/ACCESS.2023.3320138
- Sekulić, D., Mladenović, D., Ivković, I. (2023). Uticaj brzine autobusa i podužnih neravnina puta na komfor vozača i vertikalne reakcije podloge. 18. Međunarodna konferencija “Bezbednost saobraćaja u lokalnoj zajednici”, Srbija, Kopaonik.
- Sekulic, D., Vdovin, A., Jacobson, B., Sebben, S., Johannesen, S. M. (2025). Influence of floating bridge motion and wind loads on bus users’ ride comfort and motion sickness. Journal of Wind Engineering and Industrial Aerodynamics, Volume 262, 106101. https://doi.org/10.1016/j.jweia.2025.106101
- Dedović, V., Mladenović, D., Sekulić, D. (2017). Dinamika vozila (Vehicle dynamics). 1st edn.Saobraćajni fakultet, Beograd.
- Rajamani, R. (2012). Vehicle Dynamics and Control. Springer.
- Åström, K.J., Murray, R. M. (2012). Feedback Systems. Princeton University Press.
- Chen, J., Xi, D., Hu, W., Wu, Y. (2025). Improving Ride Comfort in Heavy-Duty Vehicles Through Performance-Guaranteed Control of Active Seat Suspension. Appl. Sci. 15, 7273. https://doi.org/10.3390/app15137273
- Al-Ashmori, M., Wang, Xu. (2020). A Systematic Literature Review of Various Control Techniques for Active Seat Suspension Systems. Appl. Sci. 10 (3), 1148. https://doi.org/10.3390/app10031148
- ISO 8608. (1995). Mechanical vibration-Road surface profiles Reporting of measured data, International Organization for Standardization, Geneva, Switzerland.
- Sekulic, D. (2020). Influence of Road Roughness Wavelengths on Bus Passengers' Oscillatory Comfort. The International Journal of Acoustics and Vibration. 25 (1), 41-53. https://doi.org/10.20855/ijav.2020.25.11512
- ISO 2631. (1997). Mechanical vibration and shock e evaluation of human exposure to whole body vibration, Part 1: general requirements, International Standards Organization, Switzerland.
- ISO 2631. (1985). Guide for the Evaluation of Human Exposure to Whole Body Vibration. International Standards Organization, Switzerland.
Conflict of Interest Statement
The author declares that there is no conflict of interest regarding the publication of this paper.
Author Contributions
Data Availability Statement
There is no dataset associated with the study or data is not shared.
Supplementary Materials
No supplementary materials are included in this manuscript.