Volume 24 number 1 article 1321 pages: 130-143
Received: Feb 12, 2024 Accepted: Jul 15, 2025 Available Online: Jan 21, 2026 Published: Mar 02, 2026
DOI: 10.5937/jaes0-55123
THERMODYNAMICS ANALYSIS TO EVALUATE THE COMBUSTION PROCESS OF E50 FUEL WITH INJECTION VOLUME VARIATION
Abstract
The study is based on the first and second laws of thermodynamics to investigate and analyze the performance of spark ignition engines with varying injection durations of the gasoline and bioethanol fuel blend (E50). Experiments were conducted using standard parameters of engines, including an 11:1 compression ratio and 12 bTDC of ignition timing. The injection volume of the fuel blend was set at 100% to 200% (increment of 25%) of the injection volume of gasoline. The effect of the injection volume of E50 is evident in various performance indicators, including brake-specific fuel consumption (BSFC), thermal efficiency, and brake power, as observed in both energy and exergy analyses. The most important conclusion of this study is that the performance of the engine using E50 would be similar to gasoline (E0), both in energy and exergy analyses, when the injection volume of E50 increased by 25% compared to gasoline.
Highlights
- Explain the principles of applying the first law of thermodynamics (energy analysis) and the second law of thermodynamics (exergy analysis) to evaluate the performance of SI-PFI engines.
- Analyze the differences in energy quantity and quality produced from burning E50 fuel using energy and exergy analysis methods.
- Proposing a strategy to enhance the performance of E50 fuel in SI-PFI engines by optimizing the injection volume.
Keywords
Content
1 Introduction
Natural disasters such as floods and global warming that hit parts of the world in the last decade have increased in escalation impacts to environmental damage [1]. The destruction is mainly caused by increasing carbon dioxide in the atmosphere caused by rising numbers of cars and motorcycles in the transportation sector. This is one of the negative impacts of increasing mobility and population growth [2]. Therefore, the 2015 Paris Agreement was initiated to realize CO2 emission reductions by regulating CO2 production and consumption on CO2-producing sources and limiting the use of fossil fuels [3-5]. Reducing CO2 production through recycling and CO2 capture through various media was a part of the regulation [6]. The use of alternative energy in private and public transportation continues to increase in gasoline and diesel engines to reduce carbon emissions. It is reasonable because using biofuels in vehicles can reduce carbon emissions by up to 85% [7-10].
This study aims to determine the quality of energy produced from the combustion of E50 and compare E0 with exergy analysis. This is one way to find out the sources of energy losses in the system so that improvements can be made. This work also uses a blend of gasoline and bioethanol (E50) fuels which are known to reduce hydrocarbon emissions significantly. By combining the use of exergy analysis and E50 fuel, the fuel is more efficient, and the reduction in hydrocarbon emissions is more significant, which is the main contribution of this study.
1.1 Literature review
The thermal energy plant was constructed to get a high efficiency and low energy loss unexceptional on the internal combustion engine (ICE). The engine performance indicators are displayed through thermal efficiency, mechanical power, fuel consumption, energy loss, and hydrocarbon emissions [11]. These indicators can be analyzed using the first law of thermodynamics concept approach or energy analysis [11-12]. However, energy analyses that consider energy to be eternal cannot reveal the quality, quantity, and location of energy loss in the system precisely [13]. Therefore, it required an analysis that can estimate the energy rate from the beginning to the end of the process, known as availability analysis or exergy analysis based on the second law of thermodynamics. The method can calculate the quantity and quality of energy and indicate the location and direction of the actual process that has been reducing the energy quality [14]. Exergy analyses are different from energy analyses in which exergy analyses are impermanent, so the potential energy at the beginning of the process will be reduced and not the same as energy at the end of the process due to the irreversible processes in the system, so the condition will become a trigger to producing high exergy destruction [15]. Exergy destruction occurs because the system will interact with its environment as an exergy reference before the two systems reach equilibrium [16]. Exergy analysis applications in thermal generation systems have been widely used by several researchers, especially in power plant systems [17-18], MSW gasification systems [19], and solar cells [20]. However, no literature examines the energy quality of internal combustion engines, especially those using E50 fuel with variations in injection volume.
The performance of internal combustion engines with energy and exergy analysis has been worked on by Sohret et al. [21] on a hydrogen-fueled spark ignition engine with variations in ignition timing and compression ratio. The results show that an increase in the compression ratio of 1.5% can increase the cylinder pressure by 250 kPa. Furthermore, the optimal energy and exergy values for several engine performance indicators were obtained at the ignition timing of 10 bTDC (the ignition timing range is 10-25 bTDC). Meanwhile, research conducted by Kul et al. [22] for diesel engines with the addition of 5% bioethanol to a mixture of diesel fuel (D100) with biodiesel B3, B10, B15, and B20 showed that the highest thermal efficiency, exergy efficiency, and brake power obtained when the engine uses D100 fuel. Furthermore, engine performance decreases when the percentage of biodiesel increases in diesel fuel. Panigrahi [23] also has to investigate the diesel engine performance using diesel and Simarouba biodiesel fuel blend of 20% (SB20). The results show that the fuel energy and energy in the exhaust gas of D100 are higher than in SB20 and D80 fuel blends, even though brake power and energy loss in both fuels tend to be similar. However, fuel exergy and exergy destruction of D100 are slightly higher than SB20, and exergy in brake power as well as loss of exergy in the exhaust gas tends to be similar for both fuels.
Performance investigation of the diesel engine direct injection with the addition of < 40% of CNG in diesel fuel using energy and exergy analysis has been studied by Mattson et al. [24]. The result shows that exergy efficiency will increase with an increase in CNG volume in the fuel, especially on high load, so the exergy consumption is lowest compared to the D100. Similar studies have been conducted by Yesilyurt et al. [25] with variating in injection pressure on diesel engines single cylinder by using D100 as well as oil-cooking biodiesel and canola oil fuel blend in composition 50% (v/v). The study results explained that maximum efficiency for energy and exergy analysis in diesel fuel was obtained on injection pressure of 190 bar (standard injection), while 210 bar for biodiesel fuel blend. Furthermore, the energy and exergy efficiency of biodiesel fuel increase with an increase in injection pressure, and the exergy destruction of biodiesel lowest than diesel fuel. In addition, the analysis of energy and exergy was also studied by Nazzal et al. [26] to evaluate spark engine performance. The engine operates under varying speeds using gasoline-ethanol, gasoline-butanol, and gasoline-ethanol-butanol fuel with a gasoline concentration of 85% in the three-fuel blend fixed. The results show that some engine performance indicators, such as brake power, exergy loss in heat transfer, exergy loss in the exhaust gas, brake thermal efficiency, and exergy efficiency for gasoline-butanol are higher than gasoline-ethanol fuel. However, the destruction exergy for gasoline-butanol fuel is lower than for gasoline-ethanol fuel.
Based on the many sources of literature that have been reviewed, the authors have not found energy and exergy analysis applied to a single-cylinder gasoline engine fueled with a gasoline-bioethanol mixture at a high compression ratio, and on variations of engine speed and injection volume. Therefore, to fill this void, this research is focused on assessing the performance of a 4-stroke SI-PFI engine using energy and exergy analysis. The engine operated at a compression ratio of 11:1 and an ignition of 12 bTDC (advanced of 2 bTDC from standard engine ignition), fueled by a mixture of gasoline-bioethanol (50% v/v) with variations in engine speed of 1000–7000 Rpm (100 increments) and variations in volume injection 1 – 2 times (0.25 increase) from a standard injection. The energy and energy values for variation of engine speed and injection volume are then compared to several engine performance indicators, including comparing the results if the engine uses gasoline at standard engine parameters.
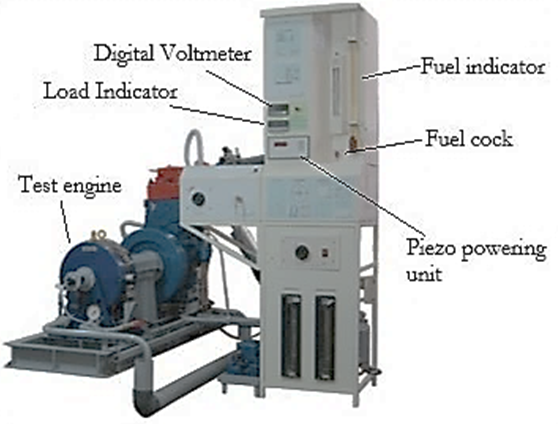
Fig. 1. Experiment set-up
2 Materials and methods
In this study, the engine used 150 cc operated at an ignition timing of 12 bTDC and compression ratio of 11:1. The E50 injection volume is also varied by 1-2 times to the EO. It was intended so that the fuel could be applied to the existing motorcycle with a suitable injection volume without any adjustment to engine construction. The mass flow rate of the fuel will be calculated based on the time it takes to spend 25 mL of fuel. The engine speed varied from 2000 to 8000 rpm with a water break dynamometer. The experiment is conducted on the wide-open throttle (WOT) so the test started at 8000 RPM of engine speed. The test engine specification (Table 1), properties of fuel (Table 2), and all of the parameters in the experiment are measured based on the maximum brake torque as one of the strategies for improving engine performance [27]. Meanwhile, the engine test is set up as shown in Figure 1.
2.1 Combustion reaction
The combustion reaction equation for air and fuel mixture based on the compound was in the fuel and air. The type of fuel used is gasoline which in Indonesia is popularly called Benzin with the compound formula C8H15 and an octane number of 94. Meanwhile, the types of ethanol used are bioethanol from molasses with a water content of < 0.5% and an octane number in a range of 109–119, and its compound formula is C2H5OH. There are a lot of bioethanol industries in Indonesia, for agriculture, health, cosmetics, and even fuel. One of them is PT. Powermax 115 in Bandung-Indonesia. Assumed the airflow into the cylinder is dry air, so the combustion reaction is given [28]:
| $a\,\mathrm{C}_8\mathrm{H}_{15} + b\left(\mathrm{O}_2 + 3.76\,\mathrm{N}_2\right) \rightarrow x\,\mathrm{CO}_2 + y\,\mathrm{H}_2\mathrm{O} + z\,\mathrm{N}_2$ | (1) |
| $a\,\mathrm{C}_2\mathrm{H}_5\mathrm{OH} + b\left(\mathrm{O}_2 + 3.76\,\mathrm{N}_2\right) \rightarrow x\,\mathrm{CO}_2 + y\,\mathrm{H}_2\mathrm{O} + z\,\mathrm{N}_2$ | (2) |
The coefficient of reaction that is a, b, x, y, and z is obtained by equating the number of atoms of the reactant elements and the number of atoms of the product elements as a result of the combustion reaction. The mole fraction of the reactants and products in the combustion reaction equation of E50 is the proportional dividing of the mole fraction of each compound in the reactants and products of combustion of E100 and E0 (Nazzal et al., 2020). For instance, 36 MJ/kg is a heating value of E50 obtained from the caloric values of E0 and E100, which are 42,4 MJ/kg and 29,6 MJ/kg. Furthermore, the molecule weight of each substance will impact the flow rate of energy and exergy in the system [29].
2.1 Energy analysis
Energy analysis is carried out with the following assumptions; (a) the engine speed (RPM) operated at a steady state, (b) the air is dry (without water vapor), (c) gas products of combustion are considered ideal gases, (d) the process takes place in an open system with To are 25oC and Po is 1 atm, (e) the kinetic energy and potential energy of the system are neglected, (f) the combustion process is complete combustion so that the combustion products produce only compounds of CO2, H2O, and N2. Based on the criteria the mass balance flow-rate equation in control volume on a steady state is given below [30-31]:
| $\sum \dot{m}_{\mathrm{in}} = \sum \dot{m}_{\mathrm{out}}\; \left[\frac{\mathrm{kg}}{\mathrm{s}}\right]$ | (3) |
Table 1. Specification of the test engine
|
Standard |
|
|
Engine type |
4 Stroke, 4 Valve, 1 cyl. |
|
Bore |
63.5 mm |
|
Stroke |
47.2 mm |
|
Displacement |
149.5 cc |
|
Compression ratio |
11:1 |
|
Ignition system |
Full transistorized |
|
Maximum power |
12.5 kW/10000 rpm |
|
Maximum torque |
13.1 Nm/8000 rpm |
|
Intake valve open |
5o BTDC, lifting 1 mm |
|
Intake valve close |
35o ABDC, lifting 1 mm |
|
Exh. valve open |
35o BBDC, lifting 1 mm |
|
Exh. valve close |
5o ATDC, lifting 1 mm |
|
Valve train |
Chain, DOHC |
where is the mass flow rate of fluid (fuels, air, and combustion gases), which is subscript stands for the entrance substance and for exit substance of the system. Substance entrance into the control volume is fuel and air, and the change in internal energy of fuel and air due to changes in cylinder pressure and volume will produce work and heat flow rate. Disregarding the kinetic energy and potential energy of the system, the energy balance equation in control under steady-state is [30-31]:
| $ \sum u + pv = \frac{Q}{m} - \frac{W}{m} [\frac{kJ}{kg}] $ | (4a) |
| $ \sum \dot{m}h = \dot{Q} - \dot{W} [\frac{kJ}{s}] $ | (4b) |
or:
| $ \sum \dot{m}_{out}h_{out} - \sum \dot{m}_{in}h_{in} = \dot{Q} - \dot{W} [\frac{kJ}{s}] $ | (4c) |
Table 2. Properties of fuels
|
E0 |
E50 |
|
|
Density, kg/m3 |
757.5 |
763.4 |
|
RVP (at 37oC), kPa |
103.4 |
51.4 |
|
MON |
88 |
88.1 |
|
RON |
94 |
103.2 |
|
HHV, MJ/kg |
44.2 |
33.34 |
|
LHV, MJ/kg |
44 |
33.72 |
|
Distillation, oC |
oC |
oC |
|
Initial boiling point |
42.1 |
329.2 |
|
10 % |
61.5 |
57.3 |
|
50 % |
102.3 |
75.1 |
|
90 % |
163.1 |
79.4 |
|
End of boiling point |
207.4 |
157.7 |
where Q ̇is the net heat rate absorbed by the system, and W ̇ denotes the work rate for the system and the specific enthalpy of substances. Therefore, the value of the mass flow rate of the flue gases can be determined from the mass conservation law, ie [32]:
| $\dot{m}_{gas} = \dot{m}_{air} + \dot{m}_{fuel} \left[ \frac{kg}{s} \right]$ | (5) |
Then, the mass flow rate of fuel was obtained from the experiment, while the mass flow rate of air was calculated with the equation:
| $\dot{m}_{air} = AFR \times \dot{m}_{fuel} \left[ \frac{kg}{s} \right]$ | (6) |
The AFR in equation 6 is an air-fuel ratio obtained from the equation below [33]:
| $AFR = \frac{4,76b}{a} \times \frac{MW_{air}}{MW_{fuel}}$ | (7) |
where “a” and “b” are reaction coefficients of fuel and air respectively in equation 1-2, while “MW” is the molecule weight of air and fuel, where the AFR of gasoline is 14.6 and 8.99 for bioethanol. The quantity of fuel energy converted into workflow and heat flow both in the exhaust gas and energy loss to the environment, written by the formula below:
| $\dot{E}_{fuel} = \dot{W} + \dot{Q}_{Exh} + \dot{Q}_{Loss} \left[ \frac{kJ}{s} \right]$ | (8a) |
Detailed parameters in equation 8a are given below:
- Fuel Energy:
| $\dot{E}_{\mathrm{fuel}} = \dot{m}_{\mathrm{fuel}} \times \mathrm{LHV} \!\left[\frac{\mathrm{kJ}}{\mathrm{s}}\right]$ | (8b) |
- Brake power:
| $\dot{W} = \frac{2\pi N T}{60}\!\left[\frac{\mathrm{kJ}}{\mathrm{s}}\right]$ | (9) |
where N is engine speed (RPM), is engine torque (Nm)
- Energy in exhaust gases:
| $\dot{Q}_{\mathrm{Exh}} = \sum \dot{m}_{\mathrm{out}}\,\Delta h = \dot{m}_{\mathrm{gas}} \left( h_{\mathrm{CO_2}} + h_{\mathrm{H_2O}} + h_{\mathrm{N_2}} \right) \; \left[\frac{\mathrm{kJ}}{\mathrm{s}}\right]$ | (10) |
- Energy lost in the system:
| $Q_{\text{Loss}} = E_{\text{fuel}} - \left( P_{\text{b}} + Q_{\text{Exh}} \right) \quad [\text{kJ/s}]$ | (11) |
Meanwhile, the engine performance is usually measured in 2 indicators, those are thermal efficiency and brake-specific fuel consumption:
- Thermal efficiency:
| $\eta_{th} = \frac{\dot{W}}{\dot{E}_{fuel}}$ | (12) |
- Brake specific fuel consumption:
| $\text{BSFC} = \frac{\dot{m}_{\text{fuel}}}{P_\text{b}} \quad \left[ \frac{\text{kg}}{\text{kW}\cdot\text{h}} \right]$ | (13) |
2.3 Exergy analysis
Assumptions in energy analysis are also used in exergy analysis so that by ignoring the potential and kinetic energy of the system, the exergy balance equation of volume control in a steady state is:
| $\sum m_{\text{in}} \, \varepsilon_{\text{in}} = \sum m_{\text{out}} \, \varepsilon_{\text{out}} + E_{\text{X,heat}} + E_{\text{X,work}} + E_{\text{X,Dest}} \quad [\text{kJ/s}]$ | (14) |
where is the total mass flow rate and specific exergy of air and fuel entering the cylinder, is the total mass flow rate and exergy specific of compounds in the exhaust gas (CO2, H2O, and N2), and is the exergy rate that accompanies heat transfer, and is calculated by the equation:
| $E_{\text{X,heat}} = \sum \left( 1 - \frac{T_o}{T_{\text{wall}}} \right) E_{\text{Loss}} \quad [\text{kJ/s}]$ | (15) |
where, is reference temperature (298 K) and is engine coolant oil, while is the exergy rate of air and fuel blend that is converted to brake power (Eq. 9), and is the algebraic sum of the incoming components minus the components leaving the system as a volume control. Furthermore, the specific exergy in form physics exergy that leaves the control volumes calculated by the equation below:
| $\varepsilon_{\text{out}} = \varepsilon_{\text{phy}} = (h_n - h_o) - T \, (s_n - s_o) \quad [\text{kJ/s}]$ | (16) |
where h and s are the specific enthalpy and entropy of each compound that leaves from control volume, subscript “n” is the compound's name from the reaction's product, and subscript “o” is the dead state of each substance. Then, Fuel exergy is obtained from the formula:
| $E_{\text{X,in}} = \dot{m}_f \, \varepsilon_{\text{fuel}} \quad [\text{kJ/s}]$ | (17) |
where is the fuel-specific exergy that is:
| $\varepsilon_{\text{fuel}} = \phi \, \text{LHV} \quad [\text{kJ/kg}]$ | (18) |
and, is the caloric value of fuel, and is the liquid fuel chemical exergy factor, and its value is obtained from the equation [26, 31]:
| $\phi = 1.0401 + 0.1728 \frac{H}{C} + 0.0432 \frac{O}{C} + 0.2169 \frac{S}{C} \, (1.216901)$ | (19) |
Where h, c, o, and s are the fuel's mass fraction of hydrogen, carbon, oxygen, and sulfur. Exhaust gas exergy consists of physic exergy (Eq. 16) and chemical exergy, so the Chemical exergy is given in the equation:
| $\varepsilon_{\text{chem}} = \bar{R} \, \ln\left(\frac{y_i}{y_o}\right) T_o \quad [\text{kJ/kg}]$ | (20) |
where is the constant universal of ideal gas i.e. 8.314 kJ/kmol. K, is surrounding temperature as a reference, is elements mole fraction in exhaust gas based on the temperature and pressure, and is elements mole fraction in exhaust gas based on the reference condition (dead state). Furthermore, the exergetic efficiency is expressed by the equation:
| $\eta_{\psi} = \frac{E_{\text{X,work}}}{E_{\text{X,in}}}$ | (21) |
3 Results and discussion
3.1 Energy and exergy analysis of fuels
This section will describe a comparison in the rate of energy and exergy of gasoline fuel (E0) and gasoline-bioethanol (E50) fuel blend both in quantity and visually in graphical form. Figures 2 and 3 show that the fuel's energy and exergy flow rate increase as the engine speed increases. It is caused by increased cylinder temperature and engine speed, so the atomization process on air and fuel blend could be better. Furthermore, the rate of energy and exergy produced in the combustion process will increase when the injection volume rises. It is contributed by the caloric value of the fuel measured in kilojoules per kilogram unit, so an increase in fuel injection volume will produce higher energy and exergy fuel. Figures 2 and 3 clearly show the difference in energy quantity of the fuel as measured by the first law of thermodynamics approach and the exergy quality of the fuel as measured by the second law of thermodynamics approach.
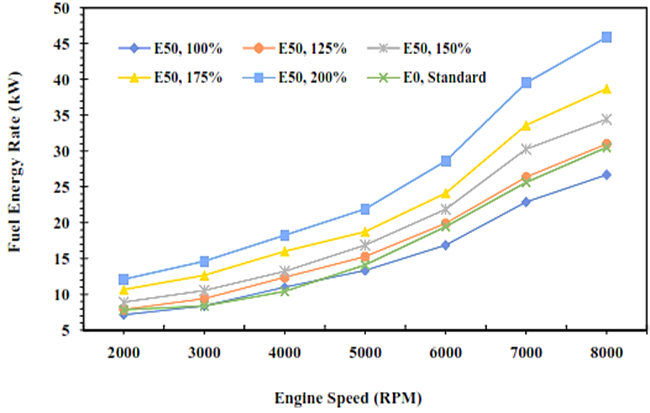
Fig. 2. Energy rate of E0 and E50 in spark engines
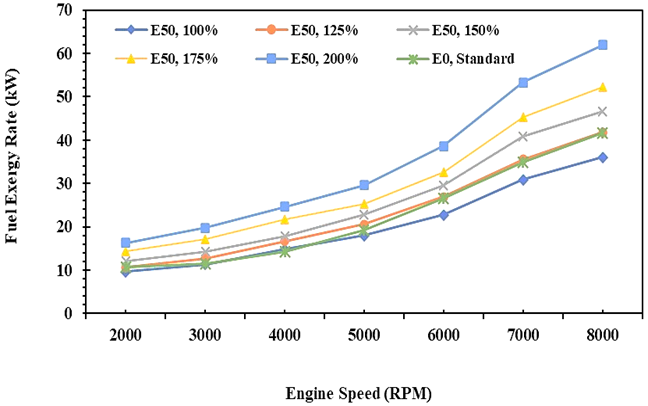
Fig. 3. Exergy rate of E0 and E50 in spark engines
This result explains that the potential power of the fuel in the initial state is higher if calculated by exergy analysis compared to energy analysis [34]. It is caused by the exergy analysis of the fuel taking into account the chemical exergy factor of the fuel in which it explores the comparison of each fuel element as described in equation 19. Meanwhile, the fuel energy analysis only measures the mass flow rate of the fuel injected and is quantified in total by the calorific value of the fuel. The fuel energy quantity obtained by energy analysis is 30.5 kW, while for exergy analysis is 41.6 kW. This result indicates that there is an energy improvement of 36.4% in exergy analysis if gasoline (E0) is applied. Furthermore, a similar trend on E50 combustion will obtain fuel energy of 45.8 kW in energy analysis and 61.9 kW in exergy analysis, or an increase of 35.2% for exergy analysis. In this case, the fuel energy of E50 is higher than E0 if the E50 injection is increased by 1.25 times greater than E0.
3.2 Brake power
The energy and exergy analysis for brake power uses the same approach as written in equation 9, and it depends on engine speed and engine torque. Figure 4 shows the comparison of the brake power between E0 and E50 in the spark ignition engine. The graph explains that the brake power tends to increase steadily with an increase in engine speed both for E0 and E50 fuel. It is due to an increase in the fuel injection volume as the engine speed increases, resulting in a higher brake power [35], as mentioned in the previous paragraph. Figure 4 confirms that increasing the fuel injection volume of the E50 will increase the engine's brake power, although after 7000 RPM tends to decrease. It is caused by friction in engine components that will increase as increase cylinder temperature and engine speed which has an impact on reducing brake power.
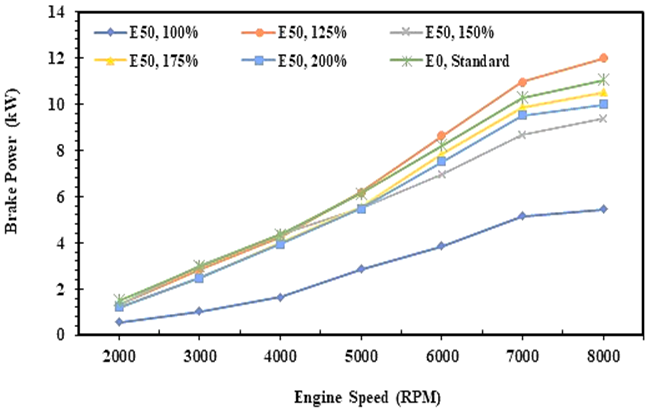
Fig. 4. Brake power of E0 and E50 in spark engines
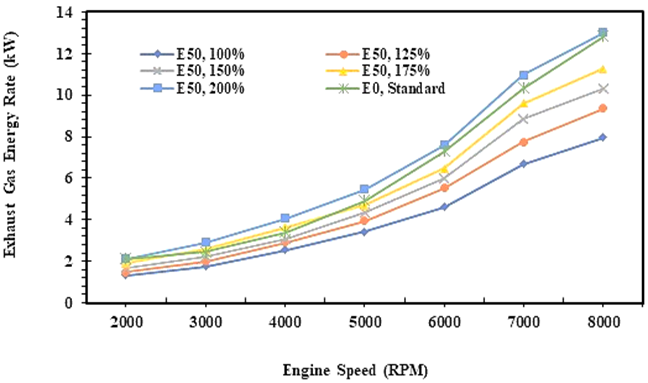
Fig. 5. Exhaust gas energy rates of E0 and E50 in spark engine
Figure 4 also shows that increasing the injection volume of E50 to 200% will cause a significant decrease in brake power. According to the data, the gasoline-bioethanol fuel blend (E50) will reach the same brake power as E0 when the E50 is injected at 125% or 1.25 times greater than the injection volume of gasoline (E0) without any adjustment on engine parameters. The experiment records that using E50 will produce a brake power of 6,31 kW on average, while a brake power of 6,35 kW will be generated when E0 is applied in the engine.
3.3 Energy and exergy rate analysis of exhaust gases
Figures 5 and 6 illustrate the energy and exergy rates of the exhaust gases in the spark ignition engine. The energy on the exhaust gas is an accumulation of the compounds in the exhaust gas, such as carbon dioxide (CO2), steam water (H2O), and nitrogen (N2), that are quantified together with the mass flow rate of exhaust gas and then calculated by equation 10. Figure 4 shows the trend of energy in exhaust gas that increases as the speed of the engine, both for EO and E50 fuel, and it is followed by the trend of exergy rate in the exhaust gas. It indicates that the greater the energy potential of the fuel, the greater the energy potential that will be lost to the exhaust gases by considering the energy in brake power [36].
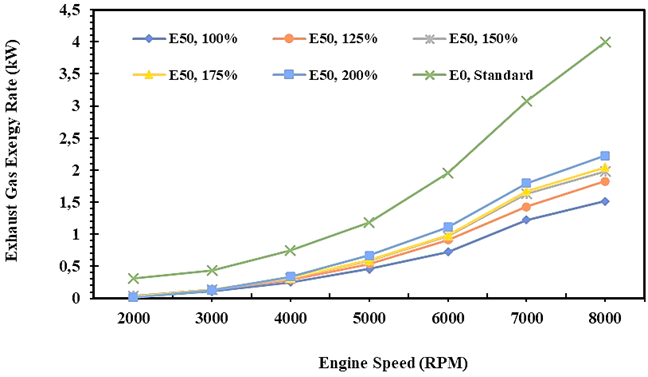
Fig. 6. Exhaust gas exergy rates of E0 and E50 in spark engine
Figure 6 shows the exergy rate of E0 in the exhaust gas is higher than E50 at all injection volume variations, while in Figure 4, it can be seen that the energy rate of E0 in the exhaust gas is slightly lower than E50 at an injection volume of 200% of E0. Figure 6 also shows that the heat generated in the combustion of E0 is higher than E50. It is affected by the calorific value of E0 which is higher than E50, so the exergy potential that is lost in the flue gas is also higher. In the thermal power plant, to minimize heat loss, especially with an exergy analysis approach, a heat recycle process can be carried out so that the heat generated can be reused in the system. Minimum energy and exergy rates for E50 fuel obtained when fuel is injected equal to E0. Minimum energy and exergy rates for E50 fuel will be obtained when the injection volume of E50 is equal to E0. Meanwhile, the energy rate of E50 is relatively similar to E0 when the injection volume of E50 is 200% higher than E0.
The study also records that the energy rate of E0 is 6,2 kW on average, while the energy minimum rate on exhaust gas for E50 is 4,0 kW on average when the injection volume is equal to E0. Furthermore, exergy analysis in flue gas at least considers 2 things, namely the accumulated amount of heat produced by the compounds of the flue gas and the production of entropy during the process so that the value is calculated by equation 16. Therefore, the exergy in the exhaust gas is lower than the energy as shown in Figures 5 and 6. Furthermore, the exergy rate of E0 in flue gas is 1,7 kW on average, while the minimum exergy of E50 is 0,6 kW on average when the injection volume of fuel is equal to gasoline (E0).
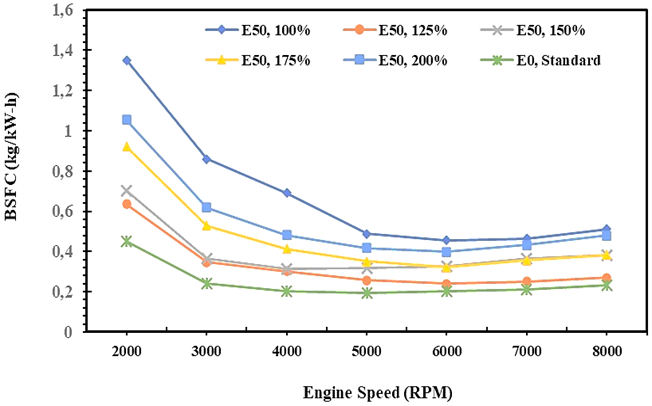
Fig. 7. BSFC of E0 and E50 fuel in spark engines
3.4 Analysis of Brake-Specific Fuel Consumption (BSFC)
Brake-specific fuel consumption is a measure of the amount of energy mass flow of fuel in every hour needed to generate every 1 kW of engine shaft power as written in equation 13. This parameter showed an injection of fuel effectively into the combustion chamber for producing the brake power of 1 kW per hour. Figure 7 demonstrates the brake-specific fuel consumption that tends to decrease when engine speed increases, both E0 and E50 fuel. It indicates that the combustion process would be better when the engine speed increased which impacts on increasing cylinder temperature. The heat in the cylinder is utilized to improve fuel vapor pressure so the atomization and injection process is easy. An increase in engine speed will produce a homogeneous air and fuel blend so combustion efficiency increases, and it has an impact on engine performance. This condition is very required for low Reid vapor pressure fuel such as bioethanol [37].
Based on the explanation above, Figure 6 shows the BSFC of E0 and E50 on the injection volume variation, which is BSFC of E0 lower than E50. It is due to the combustion process of gasoline being better than E50, particularly in the atomization process, so the specific fuel consumption of E0 decreases an increase in engine speed. The heating value and vapor pressure of E0 are higher than E50, and even the density and viscosity of E0 lower than E50 also contribute to reducing the BSFC of gasoline. Figure 6 also shows that the BSFC of E50 and E0 is similar, especially in engine speeds higher than 6000 RPM and on injection volume of 125%. The experiment also records that the BSFC of E50 tends to decrease steadily on injection volume from 1.75 up to 1.25 and starts to rise when the injection volume of E50 is equal to or twice the injection volume of gasoline. The study results reveal that the BSFC of E0 is 0.25 kg/kW-hr on average, while 0.40 kg/kW-hr for E50 is obtained on an injection volume of 1.25 times that of gasoline.
3.5 Heat energy transfer rate, heat exergy transfer rate, and exergy destruction
The energy transfer rate describes the quantity of heat generated from the combustion process that exits through the cylinder walls and cooling water and is wasted into the environment, and usually identified as energy loss as written in equation 11. The heat energy and exergy transfer rate as well as exergy destruction of engines have conversely trended with the BSFC of engines, as shown in Figures 8, 9, and 10. Figure 8 shows the heat energy transfer rate of E0 and E50 fuel that increases with the increase of engine speed. Furthermore, the heat energy transfer rate increases when the injection volume increases both for E0 and E50. This makes sense because the greater the mass flow rate of the fuel, the greater the potential energy loss under the same combustion conditions [38]. The minimum heat energy transfer rate of E50 is 22.680 MJ per hour or 6.3 kW on average, while gasoline fuel is 14.760 MJ per hour or 4.1 kW, and 35% lower than E50 on average.
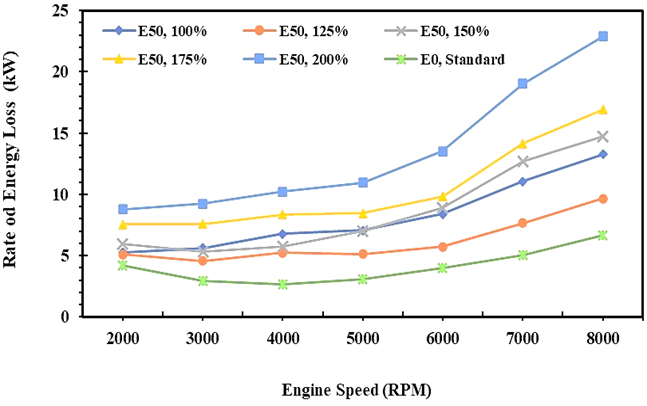
Fig. 8. Rate of energy loss of E0 and E50 in spark engines
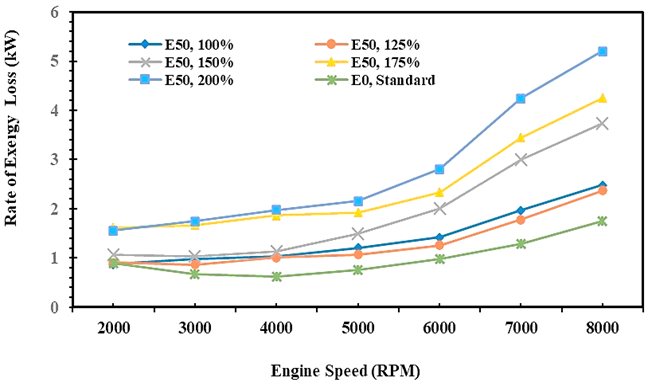
Fig. 9. Rate of exergy transfer of E0 and E50 in spark engines
Figure 9 is similar to Figure 8, although different in quantity due to the heat exergy transfer rate to the environment being lower than the heat energy transfer rate, as shown in Figure 8. It is due to the transfer of heat energy in the analysis of the 1st law of thermodynamics must be reduced by the entropy rate in the process based on the 2nd law of thermodynamics and described through the differentiation between wall temperature and environmental temperature as a reference temperature and written in equation 15. The experiment result has noted that the heat exergy transfer rate to the environment for gasoline fuel is 6.12 MJ per hour or 1.7 kW and 4.68 MJ per hour or 1.3 kW, and it is obtained when the injection volume of E50 is 125% higher than gasoline.
Figure 10 shows the exergy destruction of E0 and E50 in the spark ignition engine under varying injection volumes for E50 fuel. Exergy destruction is degraded energy quantity in the thermal plant as unuseful energy and thrown to the environment due to the irreversible process and it is calculated according to equation 14. Figure 10 shows that the exergy destruction increases with an increase in engine speed and injection volume of E50. It is due to the temperature differentiation between the system and surrounding increase with an increase in the cylinder temperature, so the condition is a trigger in producing higher exergy destruction. The exergy destruction trend shows a similar trend to the heat energy and exergy transfer rate. It is evidence that exergy destruction has a linear correlation to heat energy and exergy transfer rate.
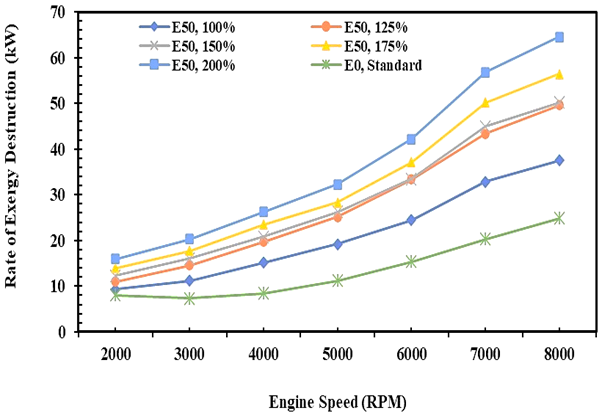
Fig. 10. Rate of exergy destruction of E0 and E50 in spark engine
The irreversible nature of a thermal process, and it is occurring spontaneously is the cause of increased entropy production of the system. So, to improve the thermal generation system, it is necessary to apply tools or components that can withstand the rate of heat leaving the system or to utilize the heat in a multi-stage and sustainable [39]. The exergy destruction quantities in this study were 13.7 kW and 14.9 kW on average for E0 and E50, respectively. The minimum exergy destruction of E50 is obtained when the injection volume of fuel is 125% higher than gasoline.
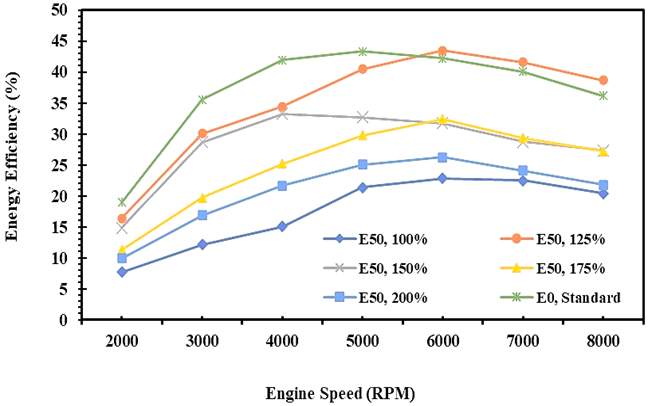
Fig. 11. The energy efficiency of E0 and E50 in spark engines
3.6 The energy and exergy efficiency
Figures 11 and 12 describe the quantity of fuel energy and exergy converted into useful energy and exergy in the form of brake power, both for E0 and E50 in spark ignition engines. Fuel energy has a similar trend with fuel exergy when the fuel is changed into the mechanics’ power, and reaches the maximum efficiency when the engine runs at 6000 RPM. The study results show both energy and exergy efficiency decrease with an increase in injection volumes of E50 fuel, and the minimum energy and exergy efficiency is obtained when the injection volume for both fuels is equal i.e. 100%.
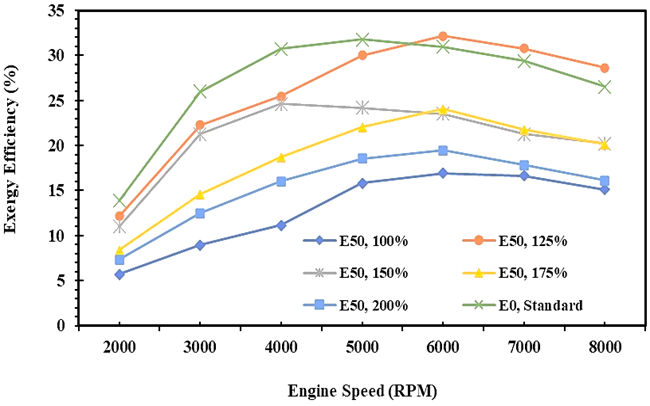
Fig. 12. The exergy efficiency of E0 and E50 in spark engines
Figures 11 and 12 also show that the quantity of fuel energy converted to the brake power for gasoline is higher than the bioethanol-gasoline blend. It is due to the enthalpy of E50 higher than E0 especially at a high speed of an engine, so the potentiality of exergy destruction is higher as an impact of wide temperature differentiation between the cylinder and the environment. This condition causes the energy and exergy efficiency for E50 fuel to be lower than E0. Moreover, in many research, the exergy efficiency is always lower than the energy efficiency [21, 27, 40]. Based on the data, it was found that the average maximum energy efficiency for E0 was 36.9%, and the maximum exergy efficiency was 27.0%. Meanwhile, the maximum energy efficiency of 32.2% and maximum exergy efficiency of 23.9% for E50, and obtained on an injection volume of 125%.
4 Conclusions
The study results show the differences in the quantity and quality of energy measured using the first law of thermodynamics and the second law of thermodynamics approaches from a thermal generation process. The energy and exergy potential of E50 fuel is higher than gasoline fuel (E0) when E50 is injected 1.25 times higher than E0. The drawback in the calorific value of E50 compared to E0 can be replaced by increasing the injection volume of E50 fuel by 25% to produce engine performance that is almost the same as gasoline. This study also shows that using E50 fuel at an injection volume of 1.25 will increase energy and fuel exergy by 48.5% - 50% compared to E0 fuel. Furthermore, the brake power of the E50 at 125% injection volume is higher than that of the E0, while the brake-specific fuel consumption of the E0 is slightly less than that of the E50.
The rate of energy and exergy that comes out through the exhaust gas for gasoline fuel is higher than for E50 fuel. Meanwhile, injecting 125% more E50 fuel than gasoline will reduce the energy released to the exhaust gas by 35% from 6.2 kW to 4.0 kW. Furthermore, there will be a reduction in exergy in the exhaust gas by 65% from 1.7 kW to 0.6 kW. Meanwhile, the energy and exergy losses due to the heat transfer process for E50 fuel are higher than those for E0. However, the energy and exergy loss in the exhaust gas will be relatively the same as E0 if E50 fuel is injected by 125% from E0 fuel.
The energy degradation in the combustion process of gasoline and E50 fuel increases with increasing engine speed for gasoline and injection volume for E50 fuel. However, the exergy destruction of E50 fuel will decrease and produce a value that is relatively the same as E0 if the injection volume of E50 fuel is 25% higher than gasoline fuel. The system's irreversible process, it is known that the exergy degradation for E0 fuel is 13.7 kW or 33% of the exergy potential for E0 fuel which is 41.6 kW. Meanwhile, E50 fuel produces an exergy destruction of 14.9 kW or 24% of the exergy potential of E50 fuel, which is 61.9 kW if injected as much as 25% more than E0 fuel. The useful energy in the thermal process using the first law of thermodynamics approach averages only around 30–40% when using the second law of thermodynamics, the value ranges from 20–30% as described in energy efficiency and energetic systems.
Acknowledgements
This work is supported by the Combustion Engine and Energy System Laboratory, Department of Mechanical Engineering, Hasanuddin University, Makassar-Indonesia, by providing the facility to carry out experimentation work, especially support from the head of the laboratory, undergraduate students, and staff.
References
- Ash Shidiqi, K., Di Paolo, A., and Choi, A. (2023). Earthquake exposure and schooling: Impacts and mechanisms. Economics of Education Review, vol. 94, 1–17. DOI: 10.1016/j.econedurev.2023.102397
- Anderson, T. R., Hawkins, E., and Jones, P. D. (2016). The greenhouse effect and global warming: from the pioneering work of Arrhenius and Callendar to today’s Earth System Models. Endeavor, vol. 40, no. 2, 178–187. DOI: 10.1016/j.endeavour.2016.07.002
- Barati, A. A., Zhoolideh, M., et al. (2023). Interactions of land-use cover and climate change at a global level: How to mitigate the environmental risks and warming effects. Ecological Indicators, vol. 146, 1–9. DOI: 10.1016/j.ecolind.2022.109829
- Paul, M. D. K. M., Lavery, S., et al. (2023). Ranking the risk of CO₂ emissions from seagrass soil carbon stocks under global change threats. Global Environmental Change, vol. 78, 1–11. DOI: 10.1016/j.gloenvcha.2022.102632
- Delistavrou, A., Tilikidou, I., and Papaioannou, E. (2023). Climate change risk perception and intentions to buy consumer packaged goods with chemicals containing recycled CO₂. Journal of Cleaner Production, vol. 382, 1–13. DOI: 10.1016/j.jclepro.2022.135215
- Yoshida, E. (2022). CO₂ capture-induced polymer complexes. Carbon Capture Science & Technology, vol. 2, 1–7. DOI: 10.1016/j.ccst.2022.100038
- Chunark, P., Thepkhun, P., Promjiraprawat, K., et al. (2015). Low carbon transportation in Thailand: CO₂ mitigation strategy in 2050. SpringerPlus, vol. 4, no. 618, 1–31. DOI: 10.1186/s40064-015-1388-6
- Kugele, A. S. H., and Sarkar, B. (2023). Reducing carbon emissions of a multi-stage smart production for biofuel towards sustainable development. Alexandria Engineering Journal, vol. 70, 93–113. DOI: 10.1016/j.aej.2023.01.003
- Thalmann, P., and Vielle, M. (2019). Lowering CO₂ emissions in the Swiss transport sector. Swiss Journal of Economics and Statistics, 155(10), 1–12. DOI: 10.1186/s41937-019-0037-3
- Moreira, J. R., Pacca, S. A., and Goldemberg, J. (2022). The reduction of CO₂ emissions in the transportation sector: Plug-in electric vehicles and biofuels. Renewable and Sustainable Energy Transition, vol. 2, 1–9. DOI: 10.1016/j.rset.2022.100032
- Taha, Y. F., Khalaf, H. J., and Hamada, K. I. (2020). An assessment of the availability and efficiency of a gasoline-fueled spark ignition internal combustion engine. Energy Sources, Part A, vol. xx, 1–22. DOI: 10.1080/15567036.2020.1825558
- Moran, M. J., and Shapiro, H. N. (2006). Fundamentals of Engineering Thermodynamics, Fifth Edition. John Wiley & Sons Inc., USA.
- Demirel, Y. (2013). Thermodynamic analysis. Arab Journal of Sciences and Engineering, vol. 38, 221–249. DOI: 10.1007/s13369-012-0450-8
- Kotas, T. J. (1995). The Exergy Method of Thermal Plant Analysis. Krieger Publishing Company, Malabar, Florida, USA.
- Dincer, I. (2018). Exergy. Comprehensive Energy Systems, vol. 1, 212–264. DOI: 10.1016/B978-0-12-809597-3.00106-1
- Sciubba, E. (2008). Exergy destruction as an ecological indicator. Encyclopedia of Ecology, 1510–1522. DOI: 10.1016/B978-008045405-4.00107-5
- Paloboran, M., Darmawang, Mandra, M. A. S., and Parenrengi, P. (2020). Performance investigation of steam boiler of PLTU Tello Makassar using energy–exergy and entropy balance approach. International Review of Electrical Engineering, vol. 15, no. 5, 431–442. DOI: 10.15866/iree.v15i5.17956
- Ibrahim, T. K., Mohammed, M. K., Awad, O. I., et al. (2018). A comprehensive review on the exergy analysis of combined cycle power plants. Renewable and Sustainable Energy Reviews, vol. 90, 835–850. DOI: 10.1016/j.rser.2018.03.072
- Couto, N., Silva, V., Monteiro, E., and Rouboa, A. (2017). Exergy analysis of Portuguese municipal solid waste treatment via steam gasification. Energy Conversion and Management, vol. 134, 235–246. DOI: 10.1016/j.enconman.2016.12.040
- Fudholi, A., Zohri, M., Jin, G. L., et al. (2018). Energy and exergy analyses of a photovoltaic thermal collector with ∇-groove. Solar Energy, vol. 159, 742–750. DOI: 10.1016/j.solener.2017.11.056
- Shohret, Y., Gürbüz, H., and Akçay, I. H. (2019). Energy and exergy analyses of a hydrogen-fueled SI engine: Effect of ignition timing and compression ratio. Energy, vol. 175, 410–422. DOI: 10.1016/j.energy.2019.03.091
- Kul, B. S., and Kahraman, A. (2016). Energy and exergy analyses of a diesel engine fuelled with biodiesel–diesel blends containing 5% bioethanol. Entropy, vol. 18, no. 11, 1–18. DOI: 10.3390/e18110387
- Panigrahi, N., Mohanty, M. K., Mishra, S. R., and Mohanty, R. C. (2016). Energy and exergy analysis of a diesel engine fuelled with diesel and Simarouba biodiesel blends. Journal of the Institution of Engineers (India): Series C, vol. 99, 9–17. DOI: 10.1007/s40032-016-0335-9
- Mattson, J., Langness, C., and Depcik, C. (2018). Exergy analysis of dual-fuel operation with diesel and moderate amounts of compressed natural gas in a single-cylinder engine. Combustion Science and Technology, vol. 190, no. 3, 470–488. DOI: 10.1080/00102202.2017.1399882
- Yesilyurt, M. K., and Arslan, M. (2018). Analysis of the fuel injection pressure effects on energy and exergy efficiencies of a diesel engine operating with biodiesel. Biofuels, vol. 10, no. 5, 643–655. DOI: 10.1080/17597269.2018.1489674
- Nazzal, I. T., and Kamil, M. (2020). Energy and exergy analysis of spark-ignited engine fueled with gasoline–ethanol–butanol blends. AIMS Energy, vol. 8, no. 6, 1007–1028. DOI: 10.3934/energy.2020.6.1007
- Paloboran, M., Syam, H., Yahya, M., and Darmawang. (2021). The development of combustion strategy in improving the performances of SI-PFI engine using E50 of gasoline–bioethanol fuel blend. Herald of the Bauman Moscow State Technical University, Series Natural Sciences, vol. 97, no. 4, 115–135. DOI: 10.18698/1812-3368-2021-4-115-135
- Dincer, I., and Rosen, M. A. (2021). Exergy (Third Edition): Chapter 2 – Exergy and energy analyses. Energy, Environment and Sustainable Development, 23–35. DOI: 10.1016/B978-0-12-824372-5.00002-6
- Meisami, F., Ajam, H., and Tabasizadeh, M. (2017). Thermo-economic analysis of diesel engine fueled with blended levels of waste cooking oil biodiesel in diesel fuel. Biofuels, vol. 9, no. 4, 503–512. DOI: 10.1080/17597269.2017.1284475
- Paloboran, M., Syam, H., Yahya, M., and Jamaluddin. (2023). Energy and exergy analysis on spark ignition engines under varying ignition timing with pure bioethanol fuel. Herald of the Bauman Moscow State Technical University, Series Natural Sciences, vol. 107, no. 2, 140–159. DOI: 10.18698/1812-3368-2023-2-140-159
- Şanli, B. G., and Uludamar, E. (2020). Energy and exergy analysis of a diesel engine fuelled with diesel and biodiesel fuels at various engine speeds. Energy Sources, Part A, vol. 42, no. 11, 1299–1313. DOI: 10.1080/15567036.2019.1635229
- Norouzi, N., Ebadi, A. G., Bozorgian, A., Hoseyni, S. J., and Vessally, E. (2022). Energy and exergy analysis of internal combustion engine performance of spark ignition for gasoline, methane, and hydrogen fuels. Iranian Journal of Chemistry and Chemical Engineering, vol. 40, no. 6, 1909–1930. DOI: 10.30492/IJCCE.2022.539658.4948
- Turns, S. R. (2000). An Introduction to Combustion: Concepts and Applications, 2nd edition. McGraw-Hill, USA.
- Kul, B. S., and Ciniviz, M. (2021). An evaluation based on energy and exergy analyses in SI engine fueled with waste bread bioethanol–gasoline blends. Fuel, vol. 286, no. 2, 1–14. DOI: 10.1016/j.fuel.2020.119375
- Canakci, M., and Hosoz, M. (2006). Energy and exergy analyses of a diesel engine fuelled with various biodiesels. Energy Sources, Part B, vol. 1, no. 4, 379–394. DOI: 10.1080/15567240500400796
- Jena, S. P., Acharya, S. K., and Deheri, C. (2016). Thermodynamic analysis of a twin-cylinder diesel engine in dual fuel mode with producer gas. Biofuels, vol. 7, no. 1, 49–55. DOI: 10.1080/17597269.2015.1118779
- Gümüş, M., and Atmaca, M. (2013). Energy and exergy analyses applied to a CI engine fueled with diesel and natural gas. Energy Sources, Part A, vol. 35, no. 11, 1017–1027. DOI: 10.1080/15567036.2010.516312
- Santos, T. B., Ferreira, V. P., et al. (2017). Energy analysis and exhaust emissions of a stationary engine fueled with diesel–biodiesel blends at variable loads. Journal of the Brazilian Society of Mechanical Sciences and Engineering, vol. 39, 3237–3247. DOI: 10.1007/s40430-017-0847-0
- Hong, B., Liu, S., et al. (2022). Energy and exergy characteristics of an ethanol-fueled heavy-duty SI engine at high-load operation using lean-burn combustion. Applied Thermal Engineering, vol. 224, 1–18. DOI: 10.1016/j.applthermaleng.2023.120063
- Bhatti, S. S., Verma, S., and Tyagi, S. K. (2019). Energy and exergy-based performance evaluation of variable compression ratio spark ignition engine based on experimental work. Thermal Science and Engineering Progress, vol. 9, 332–339. DOI: 10.1016/j.tsep.2018.12.006
Conflict of Interest Statement
The authors declare that there are no conflicts of interest regarding the publication of this paper.
Author Contributions
Data Availability Statement
There is no dataset associated with the study, or the data is not shared.
Supplementary Materials
There are no supplementary materials to include.